


Data interpretation is quickly becoming the most valuable skill in analytics, and artificial intelligence is the reason. A few years ago, building a polished report meant hours of writing queries, shaping tables and arranging visuals. Today, AI features can draft a report page, suggest a calculation and summarise a chart in seconds. Producing data output has never been faster or cheaper.
Thank you for reading this post, don't forget to subscribe!That sounds like pure good news, and in many ways it is. But when something becomes easy to produce, it stops being scarce, and scarce skills are the ones businesses pay for. If an AI assistant can create the dashboard, the valuable person is the one who can tell whether it is right, what it means and what the business should do next.
This guide explains why AI makes data interpretation more valuable than data creation, what that shift means for analysts and managers across Australia, and how Power BI training can help you build the skills AI can’t replace.
What Is the Difference Between Data Creation and Data Interpretation?
Data creation is the work of producing data outputs. It includes connecting sources, cleaning tables, writing DAX measures, building visuals and keeping reports refreshed. It answers the question “what happened?”
Data interpretation is the work of deciding what those outputs mean. It covers whether the numbers can be trusted, what is driving a change, which result matters to this particular business and what action should follow. It answers a harder question: “so what, and now what?”
For years, the two skills were bundled together, and most analyst job descriptions leaned heavily on creation. AI is now unbundling them, and the market is starting to price them very differently.
How AI Is Changing Data Creation
Tools such as Microsoft Copilot in Power BI and other AI assistants are taking over a growing share of the routine build work. They can help with tasks like these:
- Drafting a first-pass report page from a plain-language prompt.
- Suggesting DAX measures and explaining what they do.
- Summarising a visual or a page in a short narrative.
- Answering quick questions about a dataset in natural language.
- Speeding up repetitive formatting and layout work.
None of this makes analysts obsolete. It does change where the effort goes. When a first draft costs almost nothing, the draft is no longer where the value sits. The value moves to everything that happens after the draft appears on screen.
Why Data Interpretation Becomes More Valuable in the AI Era
Five forces push data interpretation up the value chain.
- The supply of reports explodes. When anyone can generate a dashboard in minutes, organisations end up with more reports than anyone can read. The scarce resource becomes judgement, not output.
- AI output must be checked. AI can be confidently wrong. It might apply the wrong filter, misread a column or write a measure that runs without errors but answers the wrong question. Someone has to catch that before it reaches a leader.
- Context lives with people. An AI model doesn’t know about last quarter’s pricing change, the store that closed for renovation or the supplier who delivered late. A skilled interpreter does.
- Accountability can’t be delegated. A board or a minister wants a person who will stand behind a recommendation. “The AI said so” isn’t a defence.
- More output creates more noise. Conflicting numbers and competing dashboards need someone to decide which one matters. We explore this problem in the dashboard graveyard.
Put simply, AI is lowering the cost of data creation. That raises the relative value of the human work that sits on top of it. This is the same pattern behind why businesses pay more for people who influence decisions than for people who only build dashboards.
Data Interpretation Skills AI Can’t Replace
Strong data interpretation skills combine technical understanding with business sense. These are the abilities that keep their value as AI improves:
- Asking the right question. A vague request produces a vague answer, from a person or a machine. Good interpreters sharpen the question before touching the data.
- Checking logic and quality. Understanding relationships, filters and data lineage so you can tell when a number looks wrong.
- Business context. Knowing the industry, the calendar and the strategy well enough to explain why a number moved.
- Statistical thinking. Spotting outliers, seasonality, small sample sizes and the difference between correlation and cause.
- Clear communication. Turning findings into a short, confident message. See why businesses pay more for people who explain data.
- Ethical judgement. Knowing what data should and shouldn’t be used for, including privacy and fairness considerations.
These skills are also the foundation of confidence in data, which is what leaders actually pay for.
Data Creation vs Data Interpretation: A Side-by-Side View

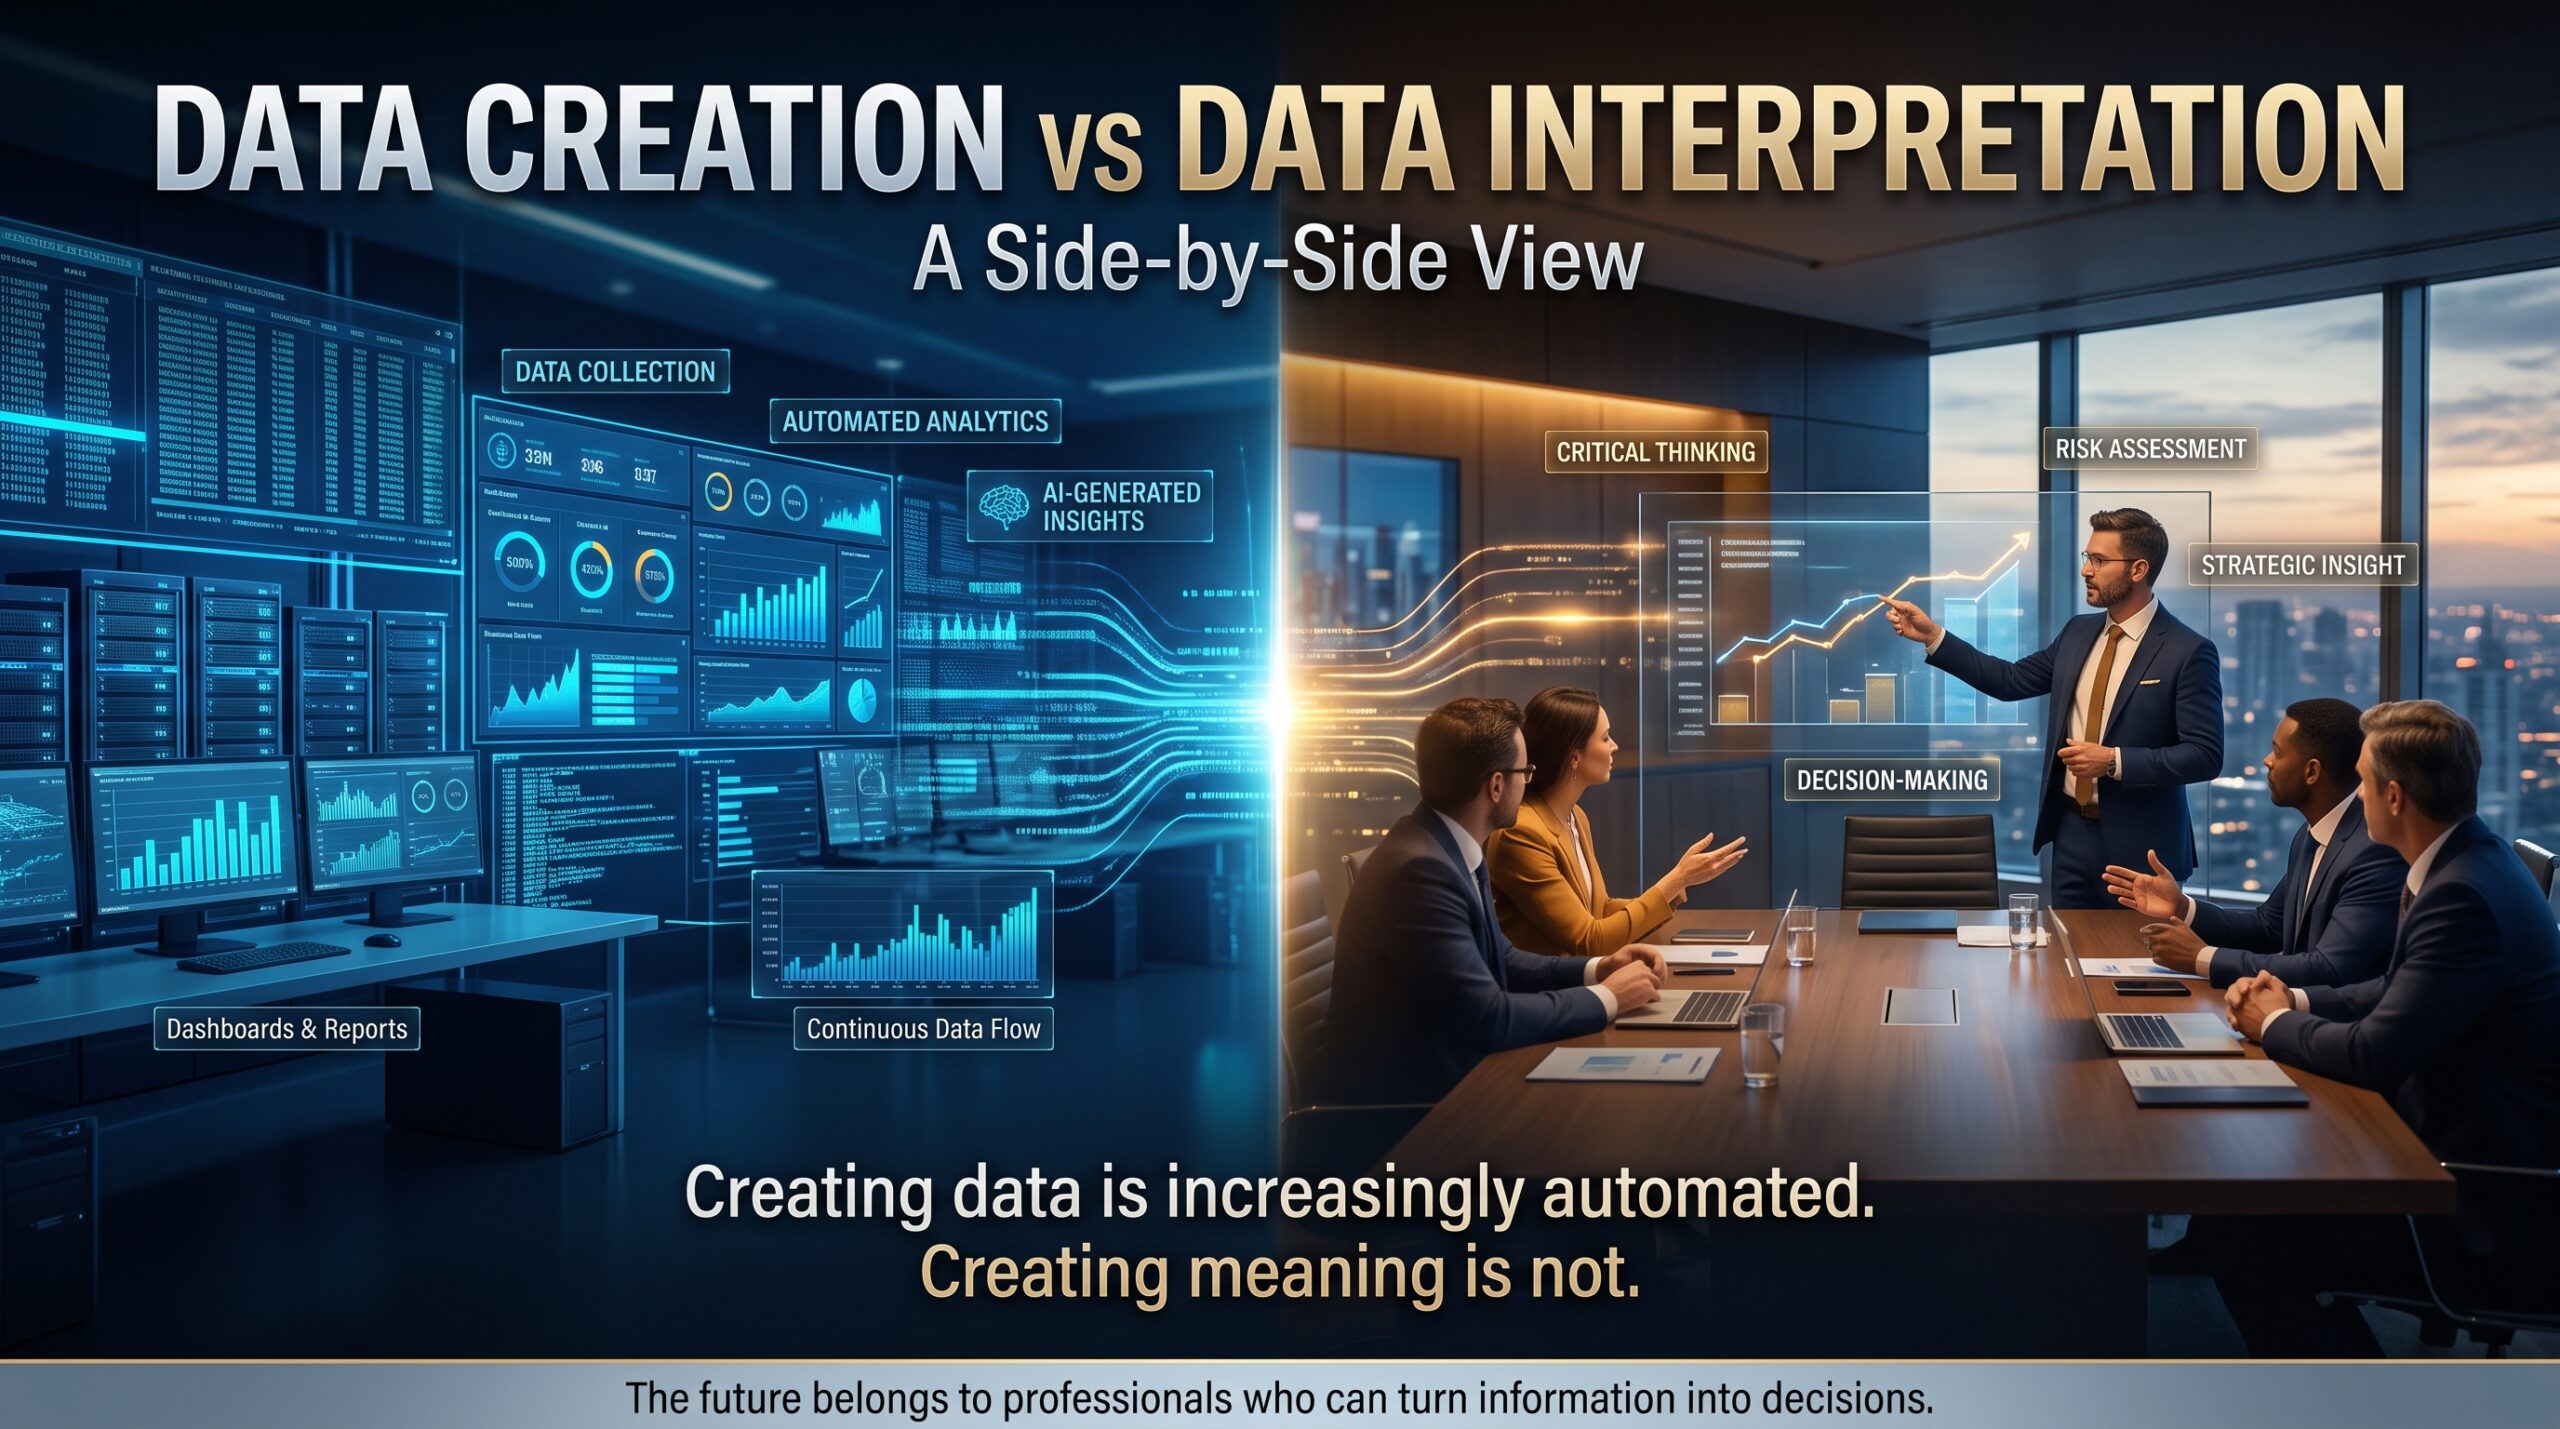
| Area | Data Creation | Data Interpretation |
| Core question | How do I build this? | What does this mean, and should we act? |
| Typical output | Reports, measures, visuals, refreshes | Recommendations, explanations, decisions |
| Effect of AI | Faster, cheaper first drafts | Confident but wrong results need catching |
| Key skills | DAX syntax, layout, data preparation | Context, judgement, statistics, communication |
| Who values it most | Reporting and IT teams | Executives, managers and clients |
The point isn’t that creation skills are worthless. You still need to understand how reports are built to judge whether they’re correct. The point is that creation alone is a weaker career position than it used to be.
Where Poor Data Interpretation Costs Money
These composite examples reflect common patterns rather than individual case studies:
- Retail in Melbourne: a dashboard shows a sales dip and an AI summary calls it falling demand. A careful analyst notices two stores were closed for renovation, so demand hadn’t fallen at all.
- Finance in Sydney: a many-to-many relationship in the model double-counts revenue. The report looks impressive and is wrong. Only someone who understands the data model spots it.
- Resources in Perth: sensor readings include faulty outliers. An automated summary treats them as real, and maintenance is scheduled for the wrong equipment.
- Government in Canberra: a large percentage increase looks alarming until someone points out it comes from a tiny base number.
In each case the report was created quickly. The loss came from reading it badly.
How to Build Your Data Interpretation Skills
You can start strengthening your data interpretation skills this month with these steps:
- Understand the model underneath. Learn how tables, relationships and filters shape every number. Our Power BI Intermediate course covers DAX, drill-through pages and governance.
- Learn DAX well enough to audit it. Don’t just paste measures from an AI assistant. Be able to read them and explain what they do.
- Ask “what would make this wrong?” Before sharing any result, list two ways it could be misleading and test them.
- Write the takeaway first. For every report, write a three-sentence summary: what happened, why, and what to do.
- Learn your industry. Spend time with the people who use your reports. Context makes interpretation faster and more accurate.
- Validate your skills. A credential such as PL-300 shows employers you can analyse and model data to a recognised standard.
Power BI Courses That Build Data Interpretation Skills
Our courses are built around real business scenarios, so you practise judgement as well as technique. Here is how the pathway maps to the skills above:
| Stage | What You Build | Course |
| Foundations | Connect and transform data with Power Query, first interactive dashboard | Power BI Beginner |
| Intermediate | DAX calculations, drill-through pages, row-level security and governance | Power BI Intermediate |
| Advanced | Complex DAX, time intelligence, model optimisation, Python and R visuals | Power BI Advanced |
| Certification | Analyse and model data to the Microsoft PL-300 standard | PL-300 Power BI Data Analyst |
| Platform overview | Understand how the Microsoft Power Platform fits together | PL-900 Power Platform |
| Analytics engineering | Fabric-based analytics for larger data environments | DP-600 Fabric Analytics Engineer |
New to analytics? Read why most Power BI learners never become data analysts and how to become a data analyst in Australia before choosing a pathway.
Where Data Interpretation Skills Are in Demand Across Australia
Demand for people who can read, challenge and explain data is visible in every major city. This is a broad picture rather than a hiring forecast:
- Sydney: finance, professional services and technology teams that need defensible numbers. We run in-person classes in the Sydney CBD area and live online. See Power BI courses in Sydney.
- Melbourne: healthcare, retail, education and state government. In-person training is available in West Melbourne. See Power BI courses in Melbourne.
- Brisbane: infrastructure, construction and fast-growing service businesses, with a Brisbane City training room. See Power BI courses in Brisbane.
- Perth: mining, energy and resources, available live online and in-house. See Power BI courses in Perth.
- Adelaide: health, defence-related and manufacturing work, delivered live online and in-house. See Power BI courses in Adelaide.
- Canberra: federal agencies where evidence has to stand up to scrutiny, delivered live online and in-house. See Power BI courses in Canberra.
Browse every Power BI training location in Australia, or ask about corporate programs for your whole team.
For Managers: Hire and Develop Interpreters, Not Just Builders
If you lead a data team, shift what you reward. Ask candidates to critique an existing dashboard instead of building a new one. Have someone other than the author review every AI-assisted report before it is shared. Add a “what could be wrong with this?” step to your reporting process.
It also helps to understand exactly what AI features do. Microsoft’s official Power BI documentation is a useful starting point for what these tools can and can’t do. Then invest in your people. Our indispensable at work and Power BI is the new Excel articles explain why this kind of capability pays off.
Frequently Asked Questions
What is data interpretation in analytics?
Data interpretation is the process of explaining what data means in a business context: checking it is reliable, identifying what drives a result and recommending what to do next. It goes beyond building charts.
Will AI replace data analysts?
AI is changing the job rather than removing it. Routine build tasks are shrinking, while checking, explaining and advising are growing in importance. Analysts who can interpret results and communicate them clearly are the best placed.
Is it still worth learning to build Power BI reports?
Yes. You need to understand how reports are built to judge whether an AI-generated one is correct. Think of creation as the foundation and interpretation as the career advantage.
Which Power BI course should I start with?
Beginners should start with the Power BI Beginner course. If you already build reports, the Power BI Advanced course or the PL-300 course are natural next steps.
Are Power BI courses available in Sydney, Melbourne, Brisbane, Perth, Adelaide and Canberra?
Yes. Courses run live online across Australia, with in-person options in Sydney, Melbourne and Brisbane. See the FAQ page or contact our team for details.
Final Thoughts: Build the Skill AI Makes More Valuable
AI will keep getting better at producing reports. That is exactly why the people who can interpret them will matter more. Data interpretation turns output into decisions, and decisions are what organisations pay for.
Ready to build practical data interpretation skills with hands-on training? Explore our Power BI courses, or call 1300 649 299 and speak to a course advisor about the right pathway for you.