


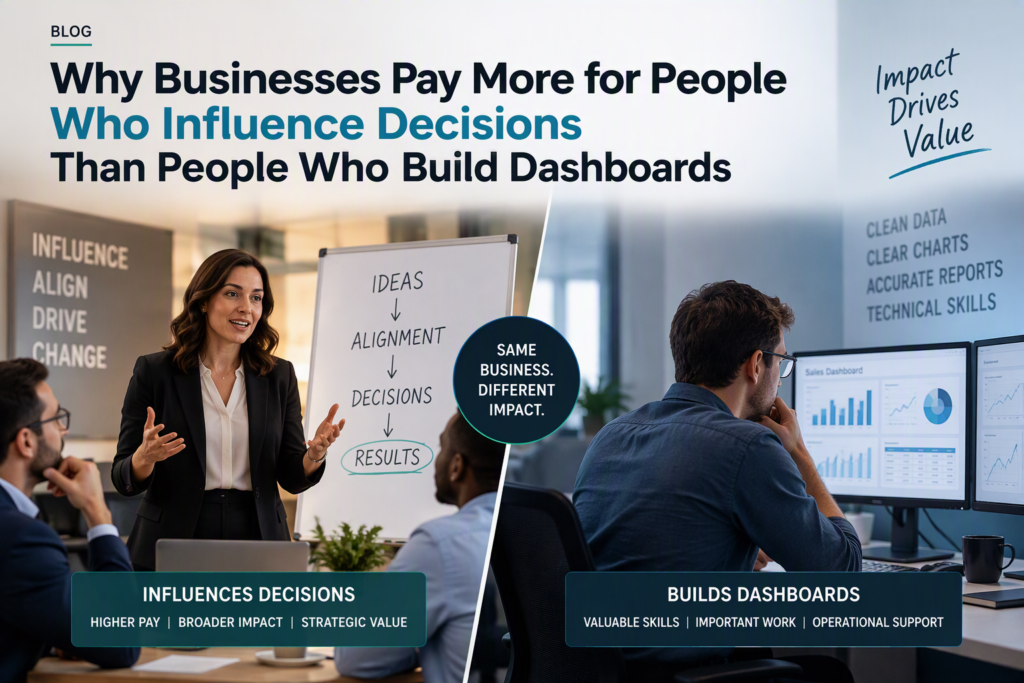
People who influence decisions with data are paid more, promoted faster and trusted with bigger problems than people who only build dashboards. That is not a criticism of dashboard builders. Building clear, accurate Power BI reports is a real skill, and it is the foundation of almost every data career. But businesses do not pay for charts. They pay for better decisions, and the person who helps leaders make those decisions is always worth more than the person who simply supplies the visuals. That is the whole case for learning to influence decisions with data.
Thank you for reading this post, don't forget to subscribe!This guide explains why that pay gap exists, what it really means to influence decisions with data, and how Power BI professionals across Australia can make the shift. You will find a practical 90-day plan, a career ladder, city-by-city insight for Sydney, Melbourne, Brisbane, Perth, Adelaide and Canberra, and the training pathways that help you get there.
Businesses Pay for Decisions, Not for Dashboards
Ask a senior leader what they want from their data team and you will rarely hear “more dashboards”. You will hear things like “tell me where we are losing margin”, “which customers should we keep”, or “should we hire now or wait”. Those are decisions, and decisions carry real money. A single good call about pricing, staffing or inventory can be worth far more than a year of reporting effort.
A dashboard is an input. A decision is the output the business actually cares about. The professional who can connect the two, who can influence decisions with data in the room where choices are made, sits closer to the value, so the business rewards them accordingly.
It is also why two people with identical Power BI skills can earn very different salaries. One delivers reports. The other changes what the business does next.
7 Reasons Businesses Pay More for People Who Influence Decisions With Data
1. Decisions carry money, dashboards carry information
Information has value only when someone acts on it. A retail manager in Melbourne might own a beautiful sales dashboard, yet if nobody changes stock orders because of it, the business gained nothing. The analyst who looks at the same data and says “reduce these three lines and increase these two” has directly moved profit. Employers pay for the movement.
2. Influence reduces the cost of bad decisions
Every business makes poor calls when it relies on guesswork, and those calls are expensive. People who influence decisions with data cut that risk by testing assumptions, showing trade-offs and flagging problems early. Preventing a costly mistake rarely appears on a report, but leaders remember who prevented it.
3. Dashboard building is becoming easier to copy
Templates, Microsoft Copilot in Power BI and a growing pool of trained analysts have made basic dashboard production faster and cheaper. That is good news for businesses and a warning for anyone whose value is only the visuals. What AI and templates cannot easily replicate is business context, judgement and trust.
4. People who influence decisions with data work closer to leadership
Proximity matters. People who influence decisions with data are in strategy meetings, budget discussions and planning sessions. Being there builds relationships, visibility and reputation, which feed straight into pay rises and promotions. Dashboard builders often sit one or two steps away, receiving requests rather than shaping them.
5. They translate between the business and the data
Most executives are not technical, and most analysts are not commercial by default. The person who can speak both languages is rare. They turn a vague business worry into a clear question, answer it with the right model, then explain the result in plain English. That translation skill is what employers struggle most to find.
6. They own outcomes, not tickets
A builder is judged on delivery: was the report finished and was it accurate? A decision influencer is judged on impact: did the churn rate fall, did the campaign improve, did the cost come down? Owning outcomes is what it means to influence decisions with data, and accountability is always paid for.
7. They are much harder to replace
Anyone with the right training can rebuild a dashboard. Nobody can quickly replace someone who understands the business, has earned the trust of its leaders and knows why the numbers behave the way they do. That scarcity is a large part of why the pay gap exists, and it grows with every year of context the person builds.
Dashboard Builder vs Decision Influencer: The Real Difference
The difference is not intelligence or technical ability. It is how the work is framed and where it ends.
| Area | Dashboard builder | Decision influencer |
| Starting point | The request or report spec | The decision the business must make |
| Output | Reports and visuals | Insight plus a clear recommendation |
| Measured by | Delivery and accuracy | Business outcomes and impact |
| Stakeholders | Receives requests | Advises and shapes priorities |
| Communication | Shares a link or file | Tells a short, confident data story |
| Scope | Narrow, tool focused | Broad, commercial and strategic |
| Replaceability | Easier to replace | Hard to replace |
Notice that every item in the right-hand column builds on the left. To influence decisions with data you still need strong Power BI skills. You simply do not stop there.
What It Takes to Influence Decisions With Data
Influence is a skill, and like any skill it can be practised. These five habits do most of the work.
- Start with the decision, not the data. Before you open Power BI, ask what choice the report will inform and who will make it.
- Understand the stakeholder. Know what your audience is accountable for, what they worry about and how much time they have.
- Build a story, not a screen. Lead with the answer, support it with two or three visuals and cut everything else.
- Make a recommendation. Always end with what you would do and why. Leaders value a clear opinion backed by evidence.
- Follow through. Check whether the decision was made and whether it worked. That feedback loop builds your credibility.
Anyone can start practising these habits today, on reports they already own. It costs nothing, and it is the quickest way to begin to influence decisions with data inside your current role.
Power BI Skills Still Matter: Build the Technical Foundation First
None of this means you can skip technical depth, because to influence decisions with data you must be right first. Credibility comes from being right, and you cannot recommend with confidence if your model is shaky. The technical foundation that supports decision influence includes:
- Data modelling: clean star schemas, correct relationships and reliable measures.
- DAX: time intelligence, calculated measures and context handling that answer real business questions.
- Power Query: repeatable, automated data preparation so your numbers stay trusted.
- Power BI Service and governance: sharing, row-level security and refresh, so leaders can rely on what they see.
- SQL, Excel and Azure basics: the supporting skills that make your analysis faster and more flexible.
- Microsoft Copilot in Power BI: a productivity boost, but only valuable if you can check the answers and explain them.
Our Power BI course is built around exactly this foundation, so you can spend your energy on influence rather than fighting your tools.
A Simple Example: From Sales Dashboard to Business Decision
Here is a realistic scenario to show the difference. A Brisbane retailer has a weekly sales dashboard built by one analyst. It shows sales by store, product and week, and it is accurate and well designed. Leaders glance at it, nod and move on.
A second analyst takes the same data and asks a different question: where are we losing margin? She finds that three discounted product lines drive most of the volume but almost none of the profit. She recommends reducing the discount depth on two of them and shifting the promotional budget to a higher-margin range, with a forecast of the likely result.
Both analysts used the same Power BI skills. Only one helped the business make a better decision. When salary reviews arrive, it is easy to see which one gets the larger offer. That is what it looks like to influence decisions with data in practice.
How to Move From Dashboard Builder to Decision Influencer: A 90-Day Plan

You can start inside your current role. Follow this plan over three months.
| Phase | Focus | What to do |
| Days 1 to 30 | Reframe your reports | For every request, ask what decision it supports. Add a one-line “so what” and a recommendation to each deliverable. |
| Days 31 to 60 | Build business depth | Meet a finance, sales or operations lead each fortnight. Learn their targets and challenges. Close any technical gaps in DAX or modelling with focused training. |
| Days 61 to 90 | Lead the conversation | Present one insight directly to a decision maker. Track what changed as a result and record the impact in numbers. |
After 90 days you will have evidence of influence, which is the strongest argument you can bring to a pay review or interview.
The Career Ladder: Where Influence Increases Your Value
As you move up, the weight shifts from building to deciding. Titles differ between employers, but the pattern is consistent.
| Role | What you own | Why the business pays more |
| Power BI developer or report analyst | Accurate dashboards and data models | Reliable delivery of core reporting |
| Senior data analyst | Insights and recommendations for a team | Better decisions inside a function |
| BI or analytics lead | Standards, priorities and stakeholder trust | Influence across several teams |
| Analytics manager | A team, a roadmap and business results | Outcomes at department level |
| Head of data or analytics | Strategy, investment and governance | Direct impact on company performance |
Every step up is a step closer to decisions, and a chance to influence decisions with data at greater scale. That is why the people at the top are paid for judgement, not for how quickly they can drag a visual onto a canvas.
How Decision-Making Roles Differ Across Australian Cities
Local industry shapes what it looks like to influence decisions with data in practice.
- Sydney: banking, insurance and consulting teams value analysts who can quantify risk and return and present it to senior stakeholders.
- Melbourne: retail, health and technology organisations reward analysts who connect customer behaviour to commercial results.
- Brisbane and the Gold Coast: government, infrastructure and tourism teams increasingly want analysts who can support planning decisions with clear evidence.
- Perth: resources and engineering firms prize people who link operational data to cost, safety and production outcomes.
- Adelaide: health, education and defence sectors value analysts who combine accuracy with clear, plain-English explanations.
- Canberra: the public service rewards those who can turn data into briefings and defensible policy recommendations.
For official guidance on building trustworthy, well-structured models, Microsoft publishes detailed Power BI guidance documentation that is worth bookmarking.
Courses That Help You Move From Reports to Influence
Structured training gives you the technical base and a recognised credential, which frees up time to influence decisions with data, and time for the commercial and communication skills that raise your value. These are the pathways Australian professionals ask about most.
- Power BI and PL-300: the core credential for Microsoft-focused teams. Explore our Power BI courses.
- Data analytics: for analysts moving into senior or lead roles. See data analytics courses.
- Excel and Power Query: the everyday skills that keep your analysis fast. Browse Excel courses online.
- Azure data certifications: cloud and platform knowledge that senior roles increasingly expect. Visit Azure certifications.
- Wider IT training: explore the full catalogue at Logitrain.
Quick Self-Audit: Do You Influence Decisions With Data?
Be honest. Each “no” shows where to focus first.
- Do you ask what decision a report supports before you build it?
- Does every deliverable include a clear recommendation?
- Can you describe how your business makes money in two sentences?
- Have you presented directly to a decision maker in the last quarter?
- Can you name a business outcome your analysis changed this year?
- Do you have a plan for commercial and communication skills as well as technical ones?
If you answered no to three or more, you probably build more than you influence, and the 90-day plan above is your starting point.
Frequently Asked Questions
Why do businesses pay more for people who influence decisions?
Because decisions move money, and people who influence decisions with data create measurable value. Dashboards supply information, but the person who helps leaders act on it is closer to the outcome and harder to replace.
How can I influence decisions with data as a Power BI developer?
Start by asking what choice each report supports, add a clear recommendation to every deliverable and share short insights directly with the people who decide. Pair this with solid data modelling and DAX so your numbers are trusted.
Are dashboard building skills still valuable?
Yes. They are the foundation, and you cannot influence anyone with unreliable numbers. The point is not to abandon technical skill but to add commercial and communication skill on top of it.
Will AI and Copilot replace dashboard builders?
AI speeds up basic report creation, which makes pure dashboard production less distinctive. Judgement, business context and trust are much harder to automate, which is why decision influence is a safer long-term career position.
How long does it take to move from builder to influencer?
Most people notice a shift in how colleagues treat them within two to three months of changing how they scope and present their work. A formal title or pay change usually follows over the next 6 to 18 months.
Stop Building for Screens. Start Building for Decisions.
The pay gap between dashboard builders and decision influencers is not a mystery. Businesses reward value, and value shows up when data changes what the organisation does. The good news is that you can influence decisions with data without changing jobs, starting with the next report you build.
Ready to strengthen the foundation? Explore our Power BI courses, build the supporting skills with data analytics training and Excel courses, or browse everything on offer at Logitrain.