


Dashboard adoption is the part of a business intelligence project that rarely makes it onto the project plan. The dashboard gets requested, designed, tested and launched with an email that says “it’s live!”. People click the link once, say it looks great, and then quietly go back to the spreadsheet they trust. Three months later, the usage report shows a handful of views, and nobody is quite sure when it last mattered.
Thank you for reading this post, don't forget to subscribe!This is the report consumption problem, and it is far more common than most data teams like to admit. This guide explains why organisations build dashboards nobody uses, what that really costs, and how to lift dashboard adoption with practical changes to design, ownership, delivery and training. It’s written for analysts, managers and anyone who has ever watched a beautiful Power BI report gather digital dust.
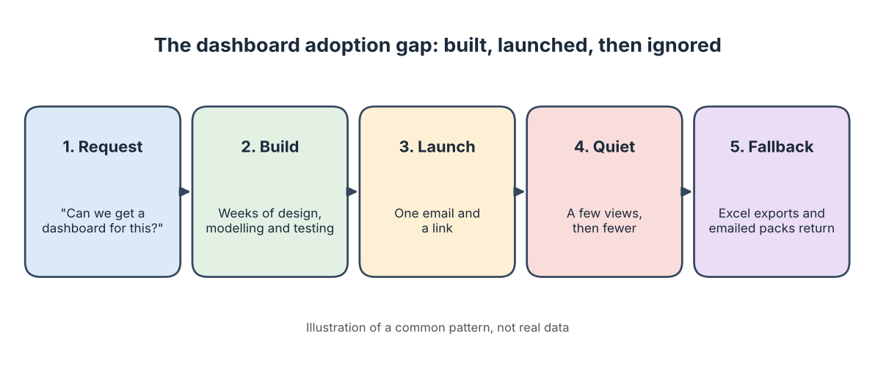
Image alt text: Dashboard adoption gap diagram showing a Power BI dashboard built, launched and then ignored
What Is Dashboard Adoption, and What Is the Report Consumption Problem?
Dashboard adoption is the extent to which the people a dashboard was built for actually open it, understand it and use it to make decisions. The report consumption problem is the gap between what gets built and what gets read. A report can be technically flawless, with a clean model, fast refresh and tidy visuals, and still fail because nobody consumes it.
The classic description of a dashboard, popularised by author Stephen Few, is a single-screen display of the most important information, designed to be understood at a glance. Many real dashboards drift a long way from that idea. They become crowded pages of charts that need a guided tour, which is a polite way of saying they never get used. Software people have a name for tools bought and then ignored: shelfware. Dashboards can become shelfware too, even when they cost nothing but time.
Low dashboard adoption isn’t a sign that your people are lazy or that your analysts are poor. It usually means the dashboard solved a problem nobody quite had.
Why Organisations Keep Building Dashboards Nobody Uses
Almost every unused dashboard has a similar backstory. Here are the most common causes.
1. It was built from a request, not a decision
“Can we get a dashboard for sales?” sounds like a clear brief, but it isn’t. It doesn’t say who will use it, which decision it supports or what they will do differently afterwards. Without that, the analyst fills the gap with every metric that might be useful, and the result helps nobody in particular.
2. It was designed for the builder, not the audience
It’s easy to fall in love with what Power BI can do: slicers, bookmarks, drill-throughs, a dozen visuals on a page. But a busy manager has about thirty seconds between meetings. If the answer isn’t obvious in that time, they’ll ask a colleague or open a spreadsheet instead.
3. The numbers don’t match, so nobody trusts them
One mismatch is all it takes. If the dashboard shows a different revenue figure from the finance pack, people stop using it, and they rarely give it a second chance. Disagreements over definitions are behind much of this, which we explore in our articles on the KPI definition gap and Power BI measure sprawl. Trust is the real currency here, as our piece on confidence in data explains.
4. It lives somewhere nobody looks
People use what sits inside their daily routine. If the dashboard requires a separate login, a bookmarked link and a memory of where it lives, it competes with email, Teams and the spreadsheet already open on their screen. Convenience usually beats quality.
5. People were never shown how to use it
A launch email isn’t training. Without a short walkthrough, many users don’t know what a slicer does, how to drill down or how to read the key measure. Low data literacy isn’t a personal failing. It’s a gap a short session can close.
6. Nobody owns it after launch
Reports break, data sources change and business questions evolve. If nobody is responsible for keeping a dashboard accurate and relevant, it slowly drifts out of date. We look at this in depth in our guide to dashboard ownership.
The Human Side: People Use What Feels Useful and Easy
Researchers have studied why people accept or reject new technology for decades. The technology acceptance model suggests two factors matter most: whether a tool feels useful and whether it feels easy to use. Dashboards fail on both counts surprisingly often. If a report doesn’t clearly help someone do their job, or if it feels fiddly to navigate, they’ll find another route to the answer.
This is why dashboard adoption is as much about people as it is about technology. A brilliant data model can’t rescue a report that doesn’t feel worth opening. It’s also why some teams build impressive screens that exist mainly to look informed, a pattern we call dashboard theatre.
The Real Cost of Low Dashboard Adoption
Poor dashboard adoption isn’t free, even if it never shows up on a budget line. Consider what an unused dashboard quietly consumes:
- Build time. Days or weeks of analyst effort that could have gone into work people actually need.
- Refresh failures, broken connections and updates that still have to be handled.
- Duplicate effort. Teams keep producing their own spreadsheets and slide packs alongside the dashboard.
- Slower decisions. People fall back on instinct or old numbers when the official report is ignored.
- Each unused project makes the next one harder to sell to the business.
The bigger issue is opportunity cost. As we discuss in the business value of data, value comes from the decisions a dashboard improves, not from the dashboard itself.
Warning Signs Your Dashboard Adoption Is Low
You don’t need to wait for a formal review. These signals usually show up early:
- Views spike in launch week and then fall away.
- Meetings still run from a PowerPoint or spreadsheet, not the dashboard.
- People regularly ask analysts to “just send the numbers” by email.
- Users export everything to Excel and rebuild their own version.
- Nobody can name who owns the report or who to ask when it’s wrong.
- Refresh failures go unnoticed for days because nobody is checking.
How to Improve Dashboard Adoption: A Practical Plan
The good news is that dashboard adoption responds well to a few deliberate habits. Here is a plan you can start applying to your next report, or retrofit onto an existing one:
- Start with the decision, not the data. Ask what choice this dashboard should help someone make, and what they’ll do differently as a result. If nobody can answer, don’t build it yet.
- Name the audience. Pick one real person who will use it every week and design for them. A report for “everyone” usually works for no one.
- Design for a glance. Lead with a small number of key measures and push detail to drill-through pages. The main page should answer the main question in seconds.
- Agree definitions before you build. Get sign-off on what each KPI means and how it’s calculated, so the numbers match the rest of the business.
- Deliver it where people already work. Publish an app in the Power BI service, share it in Teams, set up email subscriptions or data alerts, and make sure it works on mobile.
- Launch properly. Run a short walkthrough, record it for later and show people how to find what they need.
- Assign an owner. One named person should be responsible for accuracy, refreshes and change requests after launch.
- Check usage and ask for feedback. Review the Power BI usage metrics regularly, then talk to a few users about what they ignore and what they miss. Microsoft’s Power BI documentation explains the usage reporting available to you.
- Retire what isn’t used. Removing dead dashboards makes the useful ones easier to find, and it keeps your workspace honest.
How to Measure Dashboard Adoption
If you can’t measure dashboard adoption, you can’t improve it. You don’t need anything complicated. These indicators give a clear picture:
- Active viewers versus intended audience. How many of the people you built it for are actually opening it?
- Repeat usage. Do people come back weekly, or only once?
- Page-level views. Which pages are used and which are ignored?
- Export and email requests. A lot of requests for raw numbers can signal a trust or usability problem.
- Decisions referenced. In meetings, are people quoting the dashboard or something else?
Pair the numbers with conversations. Usage data tells you what is happening, while a ten-minute chat tells you why. If you’re also exploring how data turns into action, our article on data storytelling and our piece on influencing decisions with data are good next reads.
Skills That Make Dashboards People Actually Use
Strong dashboard adoption depends on skills across design, modelling and communication. Whether you are building your first report or managing a large estate of them, there is a course for most levels:
- Power BI Beginner Course for connecting data with Power Query and building a first interactive dashboard.
- Power BI Intermediate Course for DAX, drill-through pages, row-level security and governance.
- Power BI Advanced Course for complex DAX, model optimisation and Python or R visuals.
- PL-300 Microsoft Power BI Data Analyst for certification-focused preparation.
- Introduction to Microsoft Power Platform (PL-900) for a broad view of the Power Platform.
- DP-600T00 Microsoft Fabric Analytics Engineer for building analytics solutions in Microsoft Fabric.
You can compare every option on our Power BI courses page, or read more practical advice on the Power BI blog. Corporate teams can also arrange a tailored program, so a whole group can learn the same habits at the same time.
Power BI Training Across Australia: Online and In Person
Better dashboard adoption comes from teams who learn together. Training is available live online from anywhere in Australia, and in person in selected cities. Find your city below:
- Power BI course in Melbourne, with a training location in West Melbourne.
- Power BI course in Sydney, with a training location in Surry Hills.
- Power BI course in Brisbane, with a training location in Brisbane City.
- Power BI courses in Perth, available live online or onsite.
- Power BI course in Adelaide, available live online or onsite.
- Power BI course in Canberra, available live online or onsite.
You can also see the full locations page, learn more about us, read the FAQ, or contact our team on 1300 649 299 to find the right course for you.
Frequently Asked Questions About Dashboard Adoption
What is dashboard adoption?
Dashboard adoption describes how many of the intended users regularly open and rely on a dashboard to make decisions. High adoption means the report is part of everyday work. Low adoption means it was built but not used.
Why do people not use dashboards?
The usual reasons are that the dashboard doesn’t support a real decision, it is too cluttered, the numbers don’t match other reports, it’s hard to find, or nobody showed users how to use it. Trust and convenience matter more than visual polish when it comes to dashboard adoption.
What is the report consumption problem?
It is the gap between the reports an organisation builds and the reports people actually read and act on. Teams can produce a large number of dashboards while only a few are used regularly.
How can I see who is using my Power BI report?
The Power BI service includes usage metrics that show views and viewers for reports. Availability can depend on your licence and workspace settings, so check Microsoft’s documentation or speak to your Power BI administrator.
How many visuals should a dashboard have?
Fewer than most people think. Lead with a handful of key measures that answer the main question quickly, and move detail to drill-through or secondary pages. If a page needs a guided tour, it is probably doing too much.
How do I improve Power BI adoption in my organisation?
Lifting dashboard adoption takes a few deliberate steps. Start with a real decision, design for a named audience, agree KPI definitions, deliver the report where people already work, train users properly, assign an owner and review usage regularly. Small, consistent habits make the biggest difference.
Final Thoughts on Dashboard Adoption
Building a dashboard is the easy part. Getting people to open it on a busy Tuesday, trust what it says and change a decision because of it is where the real work lies. Strong dashboard adoption comes from clear purpose, careful design, shared definitions, good delivery and a bit of training, not from adding another chart.
If you’d like your team to build Power BI reports that people actually use, explore our Power BI courses in Australia or speak with a course advisor today.