


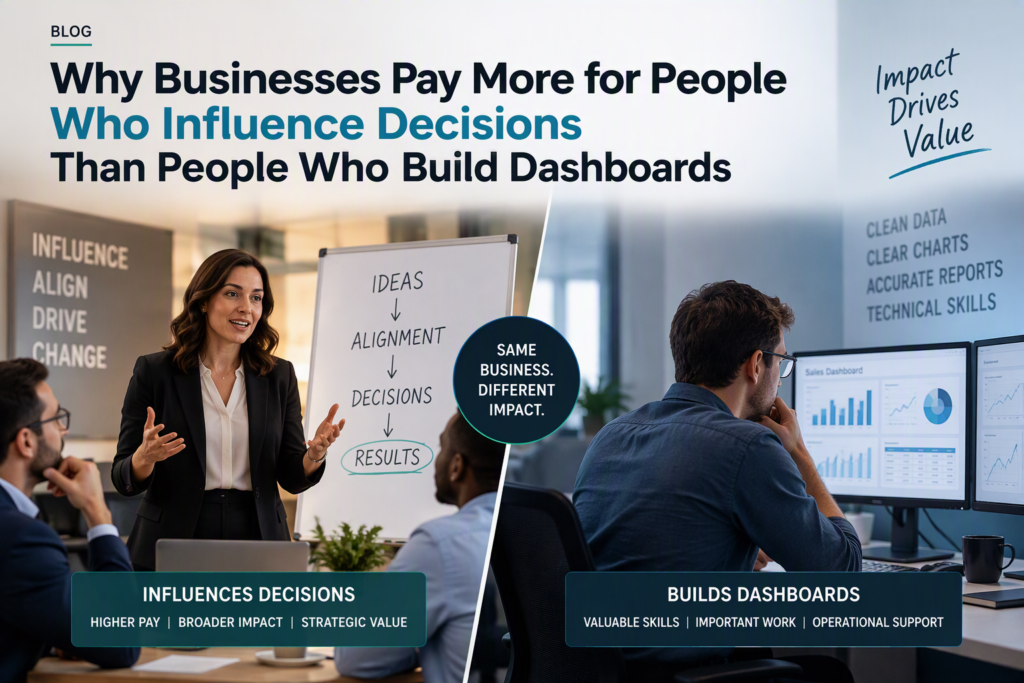
The business value of data no longer comes from having a dashboard. Almost every team in Australia has one, and many have dozens. Power BI is widely available, templates are everywhere, and AI assistants can now draft a report page in seconds. When everyone can build a chart, the chart itself stops being the thing that sets anyone apart. That is the dashboard commodity problem.
Thank you for reading this post, don't forget to subscribe!So what does create value? In this guide we look at why dashboards have become a commodity, where the business value of data really comes from, and which skills help Power BI professionals stay valuable as the tools get easier. If you work in reporting, analytics or business intelligence, this is the shift that shapes your salary and your career.
What Is the Dashboard Commodity Problem?
A commodity is something that is easy to get, similar from one supplier to the next, and competes mainly on price. Dashboards are heading that way. Ask ten analysts to build a sales overview in Power BI and you will get ten reports with similar cards, bar charts and slicers. They look professional, and they are all roughly interchangeable.
The problem is not that dashboards are bad. It is that a dashboard on its own no longer proves anything. Leaders have seen plenty of them. What they want to know is whether the numbers can be trusted, what the numbers mean, and what to do next. That is where the real business value of data sits.
Why Dashboards Became a Commodity
- Self-service BI. Business users can now connect a dataset and build visuals without waiting for IT.
- Low barriers to entry. Power BI Desktop is easy to start with, and there are thousands of free templates and tutorials.
- AI assistance. Tools such as Microsoft Copilot can suggest visuals and write first-draft summaries, which speeds up the visible part of the work.
- Platform consolidation. With Microsoft Fabric, data preparation, storage and reporting sit closer together, so building a basic report takes fewer steps.
- Open data. Even public datasets from the Australian Bureau of Statistics are free for anyone to use, which shows how access to data alone is not an advantage and why the business value of data depends on what you do with it.
None of this is a bad thing. It simply means the visible, mechanical layer of analytics is becoming cheaper. The business value of data moves to the layers that are harder to copy. We touched on this in The Dashboard Graveyard, which looks at why so many reports never influence a single decision.
Where the Business Value of Data Actually Comes From
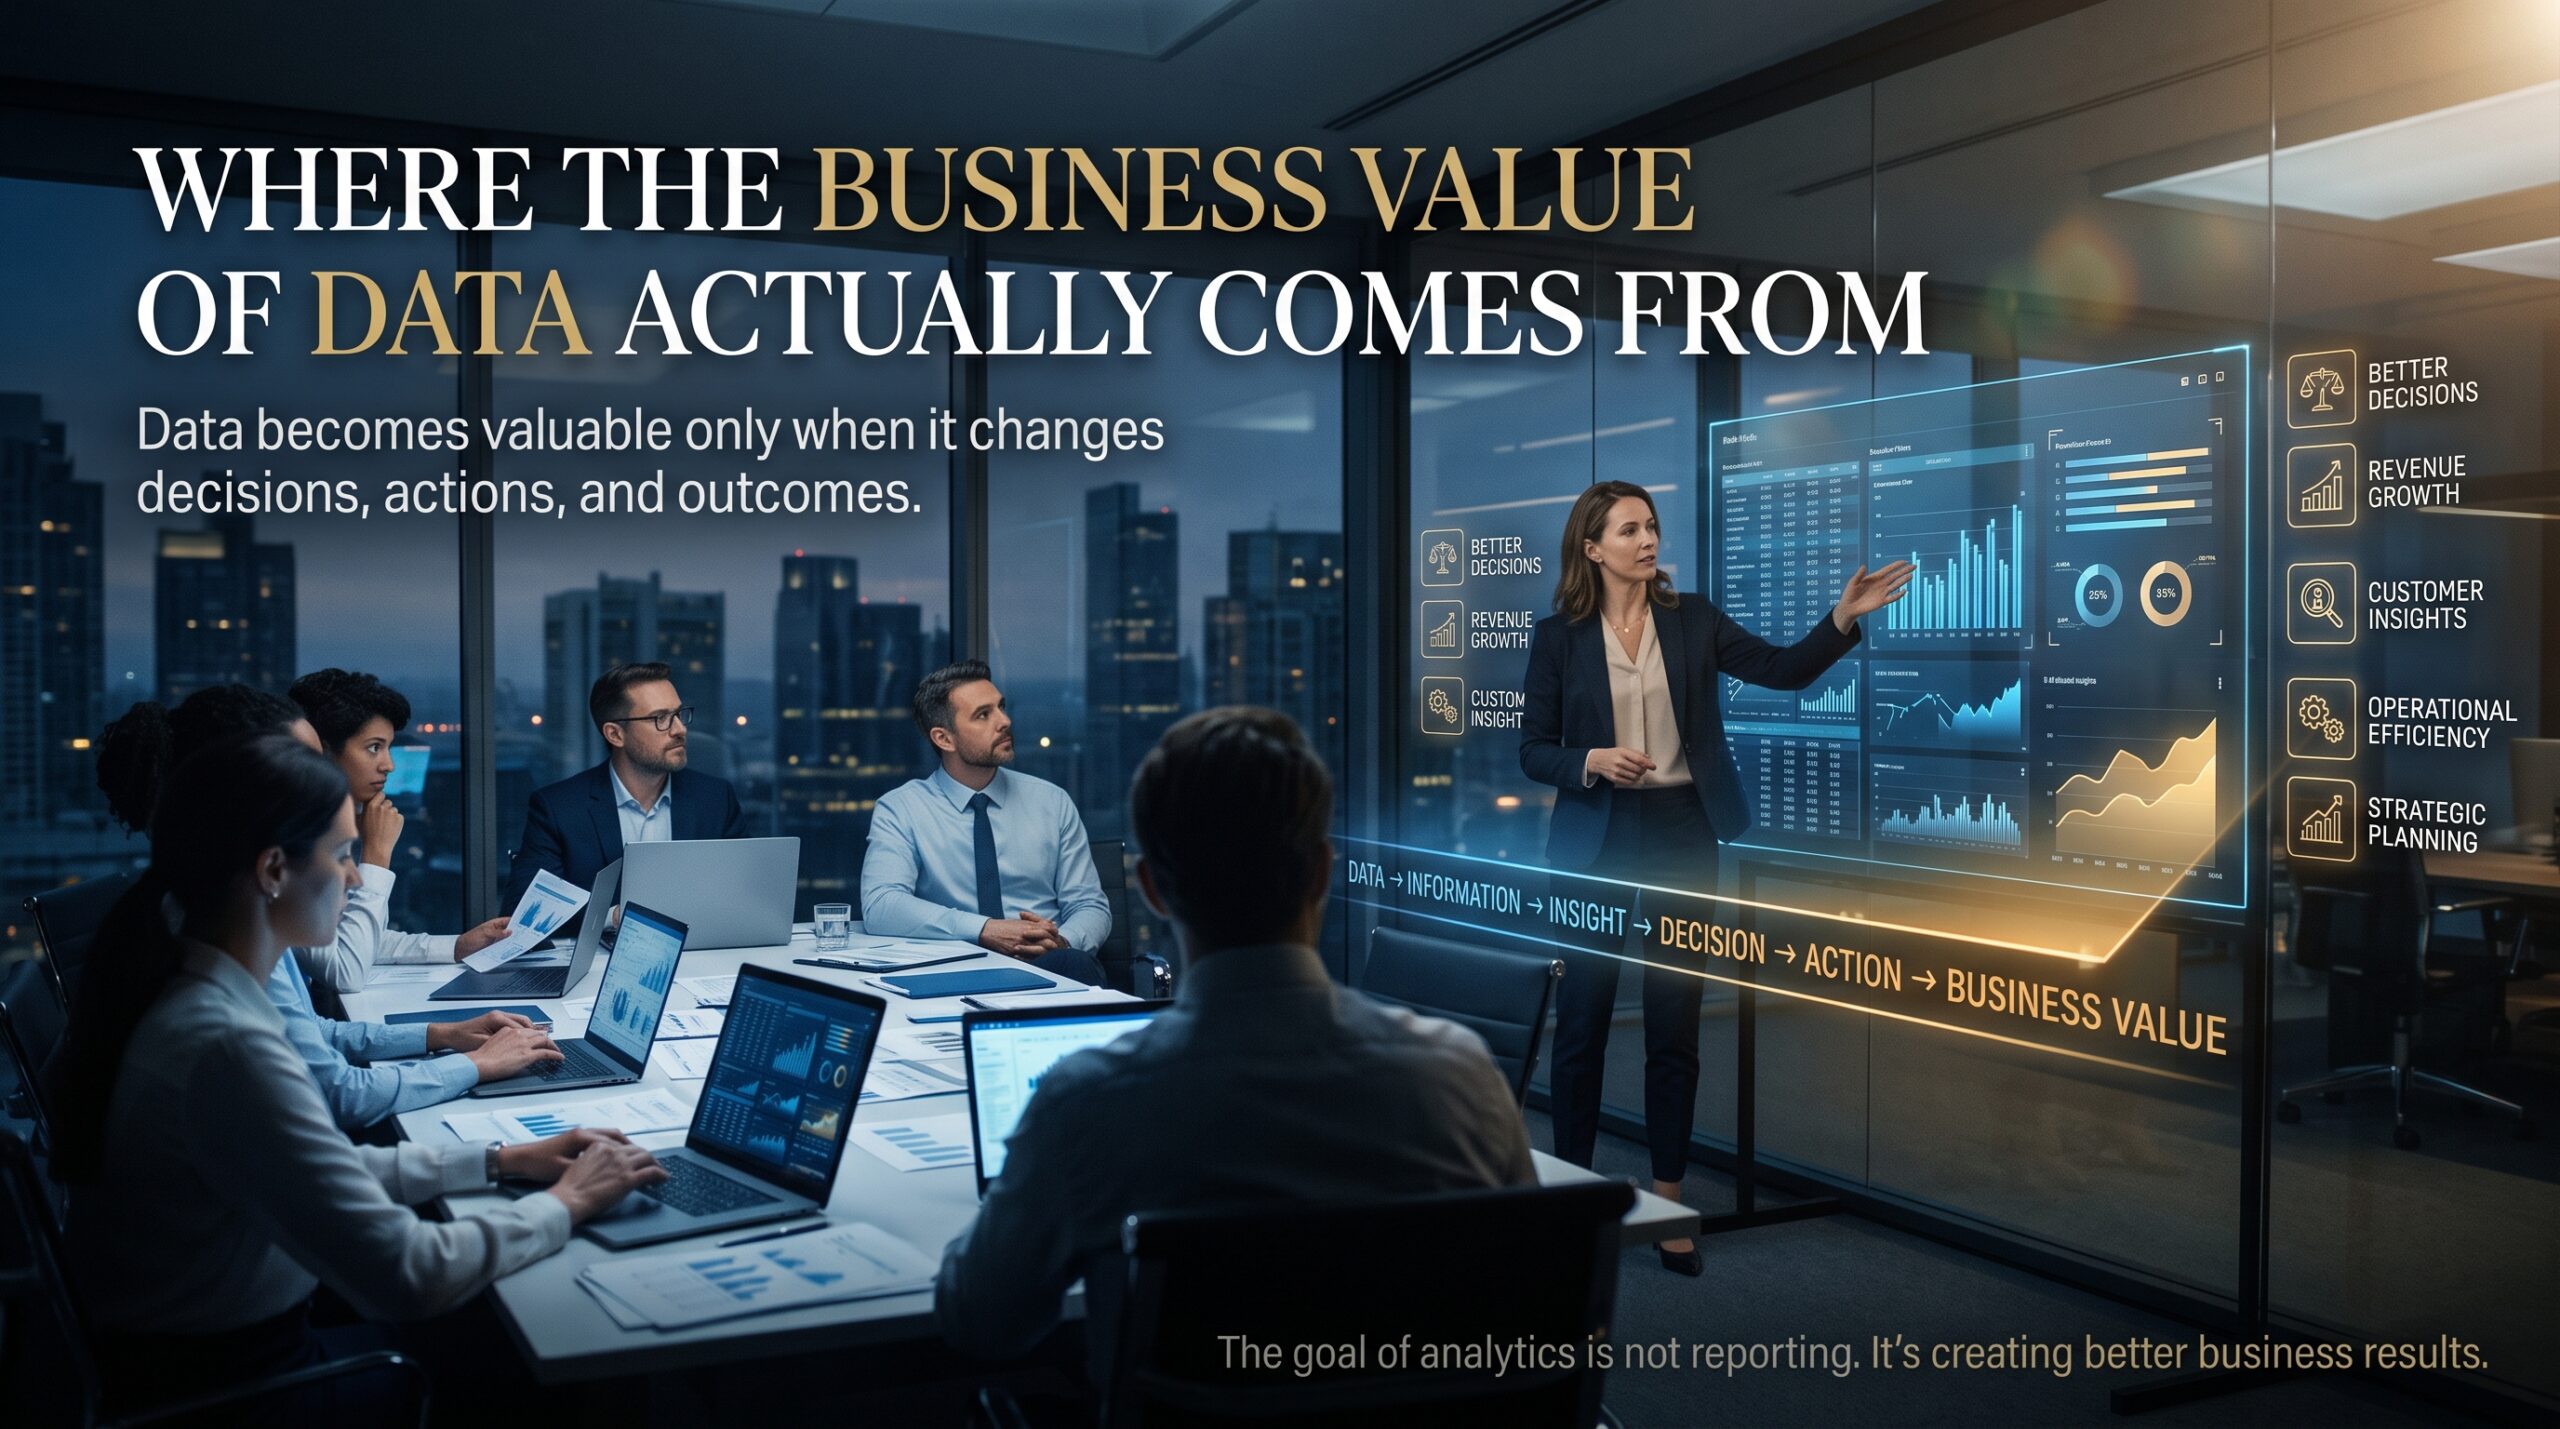
Think of a dashboard as the last ten per cent of a long chain. The business value of data is created in the other ninety. Here are the five places where it tends to come from.
1. A trusted data model and shared definitions
If sales means one thing in finance and another in operations, no dashboard will fix the argument. Analysts who build a clean data model, document definitions and make one version of the truth available create value every day, because people stop debating the numbers. This is the heart of confidence in data, and it is why skills like data modelling and DAX are still in demand.
2. Asking the right question
The most valuable analysts reshape the question before they touch the tool. “Build us a customer dashboard” becomes “Which customers are likely to leave in the next quarter, and what can we do about it?” A sharper question leads to a smaller, more useful piece of work, and a higher business value of data.
3. Speed from insight to action
A finding that arrives after the decision has been made has no value. Teams that shorten the gap between data, discussion and action get far more out of the same information. Good refresh schedules, alerts and clear ownership all help.
4. Explaining what the numbers mean
Anyone can show a drop in revenue. Fewer people can explain why it happened and what the leadership team should do. Our article on why businesses pay more for people who explain data and the piece on influencing decisions with data both cover this skill in more depth.
5. Following up on outcomes
The final source of value is the one most teams skip. Did the decision work? Did the metric move? Analysts who close the loop learn what is useful, drop what is not and build a reputation for results.
| Area | Commodity dashboard | Value-creating analytics |
| Starting point | A request for a report | A business decision that needs support |
| Data foundation | Whatever is in the export | A governed, documented data model |
| Output | Charts and filters | A recommendation, with the evidence behind it |
| Trust | “Is this number right?” debates | Agreed definitions and visible data checks |
| Follow-up | None once it is published | Tracks whether the decision worked |
| Who can replace it | Almost anyone, or an AI draft | Someone with context, judgment and credibility |
A Simple Example: Same Dashboard, Different Business Value of Data
Imagine a logistics business in Brisbane that tracks late deliveries. Two analysts each produce a Power BI report. The first shows delivery times by depot, by week, with attractive filters. It is accurate, and it is one of many reports the operations manager receives.
The second analyst first asks what the operations manager is trying to decide. The answer is whether to add a second shift at one depot. She builds a smaller report, links late deliveries to staffing levels, flags that two of the depots share a data-entry problem that inflates delays, and recommends where an extra shift would help most and where it would not. Same tool. Same data source. One of them has plainly created more value.
Skills That Protect You From the Commodity Trap
You do not need to avoid dashboards. You need to build the skills that sit around them and raise the business value of data you produce. These pathways give you a practical route, and each one is delivered live online or in person in major cities:
- Power BI Beginner Course for Power Query, first dashboards and report sharing.
- Power BI Intermediate Course for DAX, drill-through pages, row-level security and governance.
- Power BI Advanced Course for complex DAX, model optimisation and enterprise performance.
- PL-300 Microsoft Power BI Data Analyst for the certification employers recognise.
- DP-600T00 Microsoft Fabric Analytics Engineer for analysts moving toward the Fabric platform.
- Introduction to Microsoft Power Platform (PL-900) for the wider Power Platform picture.
Compare every option on the Power BI courses page, or read how Power BI skills are becoming the new Excel skills and whether certification or experience matters more.
The Business Value of Data Across Australian Cities
The tools are the same everywhere, but where the value sits depends on the local industry. These city pages show training options near you.
- Sydney: banks, insurers and fintechs pay for analysts who can explain risk and customer behaviour clearly. See Power BI courses in Sydney.
- Melbourne: healthcare, retail, education and state government teams need trusted, repeatable reporting. See Power BI courses in Melbourne.
- Brisbane: logistics, construction and infrastructure projects link operational data to cost and delivery. See Power BI courses in Brisbane.
- Perth: mining and energy businesses generate huge volumes of production data that needs careful modelling. See Power BI courses in Perth.
- Adelaide: health, defence and manufacturing teams value accurate, well-documented analysis. See Power BI courses in Adelaide.
- Canberra: federal agencies turn complex data into briefings under tight deadlines. See Power BI courses in Canberra.
Training for Perth, Adelaide and Canberra is available live online or as onsite delivery for teams, so location is not a barrier.
How to Show You Create Business Value From Data
In a résumé, portfolio or interview, replace tool lists with outcomes. “Built 12 Power BI dashboards” is a commodity statement. “Rebuilt the sales data model, removed three conflicting definitions of revenue and cut monthly reporting prep from two days to half a day” is a value statement. It tells an employer what changed because you were there.
A strong portfolio project does the same. Choose a messy, realistic dataset, state the decision it supports, show your data checks, and finish with a recommendation. That is far more persuasive than a gallery of attractive visuals, and it connects to the value gap between indispensable and replaceable professionals.
Common Mistakes That Keep Analysts in the Commodity Zone
- Competing on visuals. Polished design matters, but it is the easiest part for others to copy.
- Skipping the data model. Fast reports on a weak model create fast confusion.
- Counting outputs instead of outcomes. The number of reports delivered says nothing about the business value of data.
- Reporting without a recommendation. Showing the numbers is not the same as helping someone decide.
- Ignoring the business context. If you cannot explain how the company makes money, your analysis will stay generic.
- Never checking what happened next. Without follow-up, you cannot show your work made a difference.
Frequently Asked Questions About the Business Value of Data
What is the business value of data?
It is the measurable benefit an organisation gets from using data to make better decisions, such as higher revenue, lower costs, reduced risk or faster delivery. Data has no value until it changes a decision or an action.
Are dashboards still worth building?
Yes, but a dashboard is a delivery format, not the value itself. The business value of data comes from a trusted data model, a clear question and a recommendation that people act on.
Will AI replace Power BI analysts?
AI will automate more of the routine report building. Analysts who understand the business, check the data and explain the meaning are likely to become more useful, not less.
Which Power BI course helps me create more value?
Start with the course that matches your level. The Intermediate and Advanced courses cover DAX, security and model design, which sit behind most high-value work. PL-300 adds a recognised credential.
Turn the Business Value of Data Into Your Career Advantage
Dashboards are now a baseline skill. The professionals who stand out are the ones who make data trusted, understood and acted on. That is how you grow the business value of data in any organisation, and it is a skill set you can build on purpose.
Explore our Power BI courses, call 1300 649 299, or contact the team to find the right pathway for your role.