


A stale dashboard is a Power BI report that looks fully up to date while quietly showing old data. The colours are crisp, the charts are interactive, the date in the title says “today”, and yet the numbers behind it stopped updating days or even weeks ago. Nobody sees an error message. Nobody gets a warning. People simply keep making decisions from a picture of the business that is no longer true.
Thank you for reading this post, don't forget to subscribe!This is one of the most underestimated risks in business intelligence, because a stale dashboard fails in the one way people do not check for. It still works. This guide explains why Power BI reports can look current when the data is not, the most common technical and human causes, how to test your own reports, and how Australian teams in Sydney, Melbourne, Brisbane, Perth, Adelaide and Canberra can build reports that prove their own freshness.
What Is a Stale Dashboard?
A stale dashboard is any dashboard or report whose underlying data is older than the people using it believe it to be. The report itself loads quickly and behaves normally. What has gone wrong is invisible: the connection between the report and its source has stopped refreshing, so the numbers are frozen at the last successful update.
Staleness is different from a plain error. When a visual breaks, someone notices and complains. When a stale dashboard keeps rendering, it earns trust it no longer deserves. In a Power BI environment, that usually means the semantic model (the data layer behind the report, previously called a dataset) is not refreshing on schedule, while the report on top carries on displaying whatever it last stored.
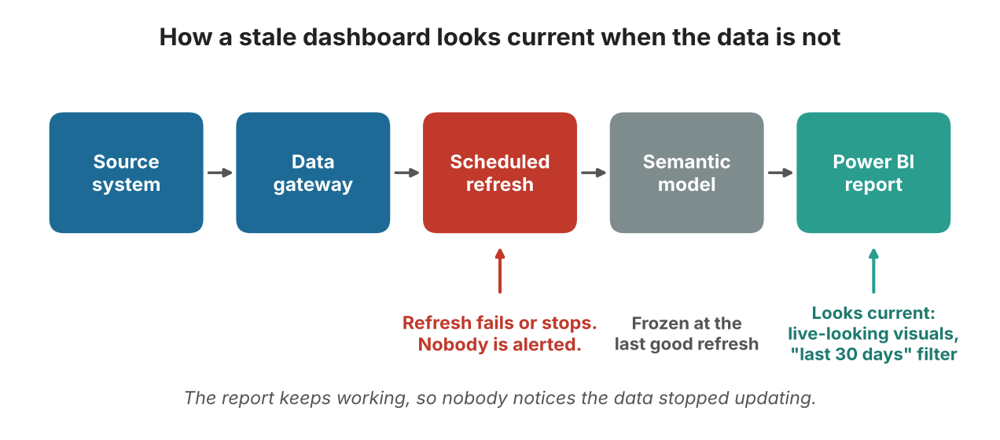
Why a Stale Dashboard Looks Current
The illusion is convincing for a handful of specific reasons. Knowing them helps you design reports that cannot fool their own audience.
- Polished visuals hide the age of the data. A well-designed page signals reliability, whether or not the figures are fresh.
- Relative date filters and TODAY(). Filters such as “last 30 days” and measures built on TODAY() move forward with the calendar even when the data does not, so the report appears to be rolling along.
- Time zones. In the Power BI service, functions such as TODAY() and NOW() work in UTC rather than local Australian time, which can shift dates and make freshness harder to judge.
- Partial refreshes. One table may update while another stays frozen, so totals look plausible and mismatches go unnoticed.
- Cached tiles and pinned visuals. Dashboards built from pinned tiles can show earlier snapshots until the underlying data updates.
- No visible refresh date. If the report never states when it was last refreshed, viewers assume the answer is “recently”.
Common Causes of a Stale Dashboard in Power BI
Most stale reports trace back to a small number of root causes. Microsoft documents the refresh process in detail in its guide to data refresh in Power BI, and the same themes appear again and again in real workspaces.
A Failed Scheduled Refresh
Refreshes fail for ordinary reasons: a password changed, a credential expired, a source table was renamed, or a file moved. Power BI can also pause a scheduled refresh after repeated failures or long inactivity. The scheduled refresh settings and refresh history show whether this has happened. If nobody is watching them, a stale dashboard can persist for weeks.
An Offline or Unmanaged Gateway
Reports connected to on-premises sources depend on a data gateway. If the machine hosting it is switched off, restarted or retired, scheduled refreshes quietly stop. This is especially common when a gateway was set up by one person who later changed roles.
Refresh Limits and Timeouts
Refresh frequency and duration depend on licence type and capacity, and very large models can time out. Techniques such as incremental refresh reduce the load by refreshing only recent data, which lowers the chance of a failed run.
Confusion Between Import and Live Modes
Import mode stores a copy of the data and needs scheduled refreshes. DirectQuery and live connections read from the source at query time. Teams sometimes assume a report is “live” when it is actually an imported snapshot, which is a classic route to a stale dashboard.
Upstream Data That Is Not Ready
A refresh can succeed technically and still load old data. If a source system finishes its overnight job at 6 am but the Power BI refresh runs at 5 am, the report refreshes on time and reads yesterday’s figures. Success in the log is not the same as freshness in the data.
Nobody Owns the Report
Behind most technical failures sits a human one. When a report has no named owner, nobody feels responsible for noticing that it stopped updating. We explore this in dashboard ownership and the KPI ownership gap.
What a Stale Dashboard Costs the Business
The cost rarely appears as a single dramatic failure. It builds through small decisions made on outdated numbers.
- Retail and e-commerce: stock and sales reports lag behind reality, so reorders and promotions miss the moment.
- Finance: forecasts and cash reports built on old ledgers lead to wrong conclusions in board packs.
- Operations and logistics: capacity and delivery dashboards fail to show a developing problem until customers complain.
- Healthcare and government: service-demand reports that trail behind actual demand delay resourcing decisions.
There is a trust cost too. Once a leader discovers that a stale dashboard has misled a meeting, they stop believing every other report as well. That damage is hard to repair, and it connects directly to the themes in confidence in data and dashboard adoption.
How to Check Whether You Have a Stale Dashboard
You can test any Power BI report in about fifteen minutes. Work through these steps for the reports your business depends on most.
- Check the last refresh time. In the Power BI service, open the workspace and look at the refresh details for the semantic model behind the report.
- Read the refresh history. Look for failed or skipped runs, and for long gaps between successful ones.
- Compare a known number with the source. Pick one figure you can verify, such as yesterday’s sales total, and match it against the source system.
- Find the latest date in the data. Add a simple card showing the maximum date in your main fact table. If it is days behind, you have found the problem.
- Review the gateway. Confirm the gateway is online and that credentials for each data source are valid.
- Check time-zone behaviour. See whether TODAY() or NOW() is driving key visuals, and whether UTC is shifting results.
- Ask who owns it. If nobody can name the owner, treat the report as at risk.
How to Fix and Prevent a Stale Dashboard
Fixing a single broken refresh takes minutes. Preventing the next stale dashboard takes design. These practices make staleness visible, so it can never hide behind a polished report again.
- Show a data-freshness label on every page. Display the last successful refresh time in Australian time, converted from UTC, so every viewer can judge the age of the data at a glance.
- Add a latest-date check. Show the most recent date in the data next to the refresh time. If the two disagree, something upstream is late.
- Turn on refresh failure notifications. Send alerts to a shared mailbox or team channel, not just to one person’s inbox.
- Use stable credentials. Avoid tying refreshes to a personal account that can expire or leave the company.
- Schedule refreshes after the source finishes. Align refresh times with upstream jobs rather than guessing.
- Use incremental refresh for large tables. Refresh only what has changed so runs are faster and less likely to fail.
- Monitor the gateway. Treat it as critical infrastructure with a named owner and a documented restart process.
- Name an owner for every report. Put the name and contact on the report itself.
- Write a simple freshness standard. State how fresh each report must be, who checks it and what happens when it falls behind.
- Train the team. People who understand how refresh works notice problems earlier and fix them faster.
Writing a Freshness Standard to Stop a Stale Dashboard
A freshness standard is a short, plain-language agreement between report owners and report users. It states how current each dashboard must be, for example “updated by 7 am every weekday”, and it names who is responsible when that promise is missed. Pair it with the habit of displaying freshness on the report, and a stale dashboard becomes a visible, fixable event instead of a silent one. If your reports also disagree with each other, it is worth reading about measure sprawl and the KPI definition gap at the same time.
Stale Dashboard Risks Across Australian Cities
The stress points differ a little from city to city. You can find in-person and live online options for every location on our locations page.
Sydney
Finance, banking and professional services teams in Sydney run fast reporting cycles where a day-old figure can change a decision. Explore our Power BI course in Sydney, available in person and live online.
Melbourne
Melbourne’s healthcare, education, retail and government teams often share large reporting estates with many owners. See our Power BI course in Melbourne.
Brisbane
Construction, infrastructure and resources reporting in Queensland depends on timely project and cost data. Browse our Power BI course in Brisbane.
Perth
Mining and energy operations in Western Australia depend on frequent operational reporting, often from remote sites and gateways. Check out Power BI courses in Perth, delivered live online or in-house.
Adelaide
Manufacturing, health and defence-related teams in South Australia rely on dependable monthly and weekly reporting. Learn more about our Power BI course in Adelaide.
Canberra
Public sector teams in Canberra work under strict accountability standards, where being able to prove how fresh a report is matters. View our Power BI course in Canberra.
Power BI Skills That Prevent a Stale Dashboard
Most refresh problems come from gaps in understanding, not bad intent. When builders know how data flows from source to semantic model to report, they build reports that tell the truth about their own age. These Power BI courses in Australia cover the skills that matter most.
- Power BI Beginner Course: connect and transform data with Power Query and build your first dashboard.
- Power BI Intermediate Course: write DAX, build drill-through pages and apply row-level security and governance.
- Power BI Advanced Course: optimise data models for performance and use advanced DAX and time intelligence.
- PL-300 Microsoft Power BI Data Analyst: prepare for the certification and learn to prepare, model and deploy reliable reports.
- DP-600T00 Microsoft Fabric Analytics Engineer: build analytics solutions at scale in Microsoft Fabric.
- Introduction to Microsoft Power Platform (PL-900): understand the wider Power Platform and where Power BI fits.
Unsure where to start? Our FAQ page covers prerequisites and delivery options, and the blog has more guides, including dashboard theatre and the business value of data.
Frequently Asked Questions About Stale Dashboard Problems
What is a stale dashboard?
It is a dashboard that appears current but shows data older than viewers assume, usually because the underlying refresh has failed or stopped without anyone noticing.
Why is my Power BI report not updating?
Common reasons include a failed scheduled refresh, expired credentials, an offline gateway, a source that was not ready when the refresh ran, or a report that uses imported data without any refresh schedule.
How do I show when a Power BI report was last refreshed?
Add a refresh timestamp to your data model and display it on each page, converted to Australian time. Pair it with a card showing the latest date in your main data table.
Does a successful refresh mean the data is current?
Not always. A refresh can succeed while loading old data if the source system had not finished updating. Check the latest date in the data as well as the refresh status.
Which course teaches reliable Power BI reporting?
The Intermediate and Advanced Power BI courses cover data modelling, governance and performance, and the PL-300 course prepares you for the Microsoft Power BI Data Analyst certification.
Final Thoughts: Make Freshness Visible
A stale dashboard is dangerous because it looks perfect. The fix is not more dashboards but more honesty inside the ones you already have: show the refresh time, check the latest date, alert on failure and give every report an owner. Do that, and your reports will tell people not only what the numbers are but how old they are.
Ready to build those skills? Visit Power BI Course Australia, explore the full course list, or contact our team or call 1300 649 299 to speak with a course advisor.