


The KPI definition gap is the reason three smart teams can look at the same business and report three different numbers. Sales says the company closed a strong month. Finance says revenue was flat. Operations says half of those orders have not shipped yet. Everyone is using the same word, everyone is technically correct, and the leadership meeting runs out of time before anyone discusses a decision. This guide explains what the KPI definition gap is, why it appears between sales, finance and operations, what it costs, and how to close it with clear definitions, a governed data model and practical Power BI courses.
Thank you for reading this post, don't forget to subscribe!What Is the KPI Definition Gap?
The KPI definition gap is the difference between how departments define, calculate and name the same key performance indicator. A KPI is only useful when everyone agrees what it measures, which data it uses, which filters apply and which time period counts. When those agreements are missing, each team builds its own version, and every version is defensible.
It is different from a data quality problem. The data may be perfectly accurate in each system. The disagreement sits in the definition: what counts as a sale, a customer, a delivery or a month. That is why simply cleaning the data rarely fixes it.
It also overlaps with the issues we have covered in our articles on Power BI measure sprawl and dashboard ownership. Measure sprawl is how the KPI definition gap shows up inside reports, and weak ownership is why it stays unresolved.
How Sales, Finance and Operations End Up With Different Numbers
Each department looks at the business through its own system and its own purpose. These examples show how the same word can mean different things.
- Sales may count a deal as revenue when the contract is signed. Finance may count it when the invoice is issued or the service is delivered. Operations may count it when the goods leave the warehouse.
- Sales counts anyone who has signed. Finance counts only accounts with an invoice. Operations counts sites or delivery addresses. One company can be one customer or five.
- Active customer. One team counts anyone who purchased in the last 12 months, another uses 90 days, and a third counts anyone with an open account.
- On-time delivery. Operations measures against the promised date. Sales measures against the date the customer expected. Finance does not measure it at all.
- Sales looks at price minus cost of goods. Finance includes freight, discounts and returns. Operations may exclude overheads entirely.
- Conversion rate. The denominator might be leads, qualified leads or opportunities, and each choice produces a very different percentage.
- Reporting period. Calendar month, financial month, four-week cycle and rolling 30 days can all appear in one meeting.
None of these teams is wrong. They are answering slightly different questions with the same label, which is the heart of the KPI definition gap.
Why the KPI Definition Gap Keeps Growing

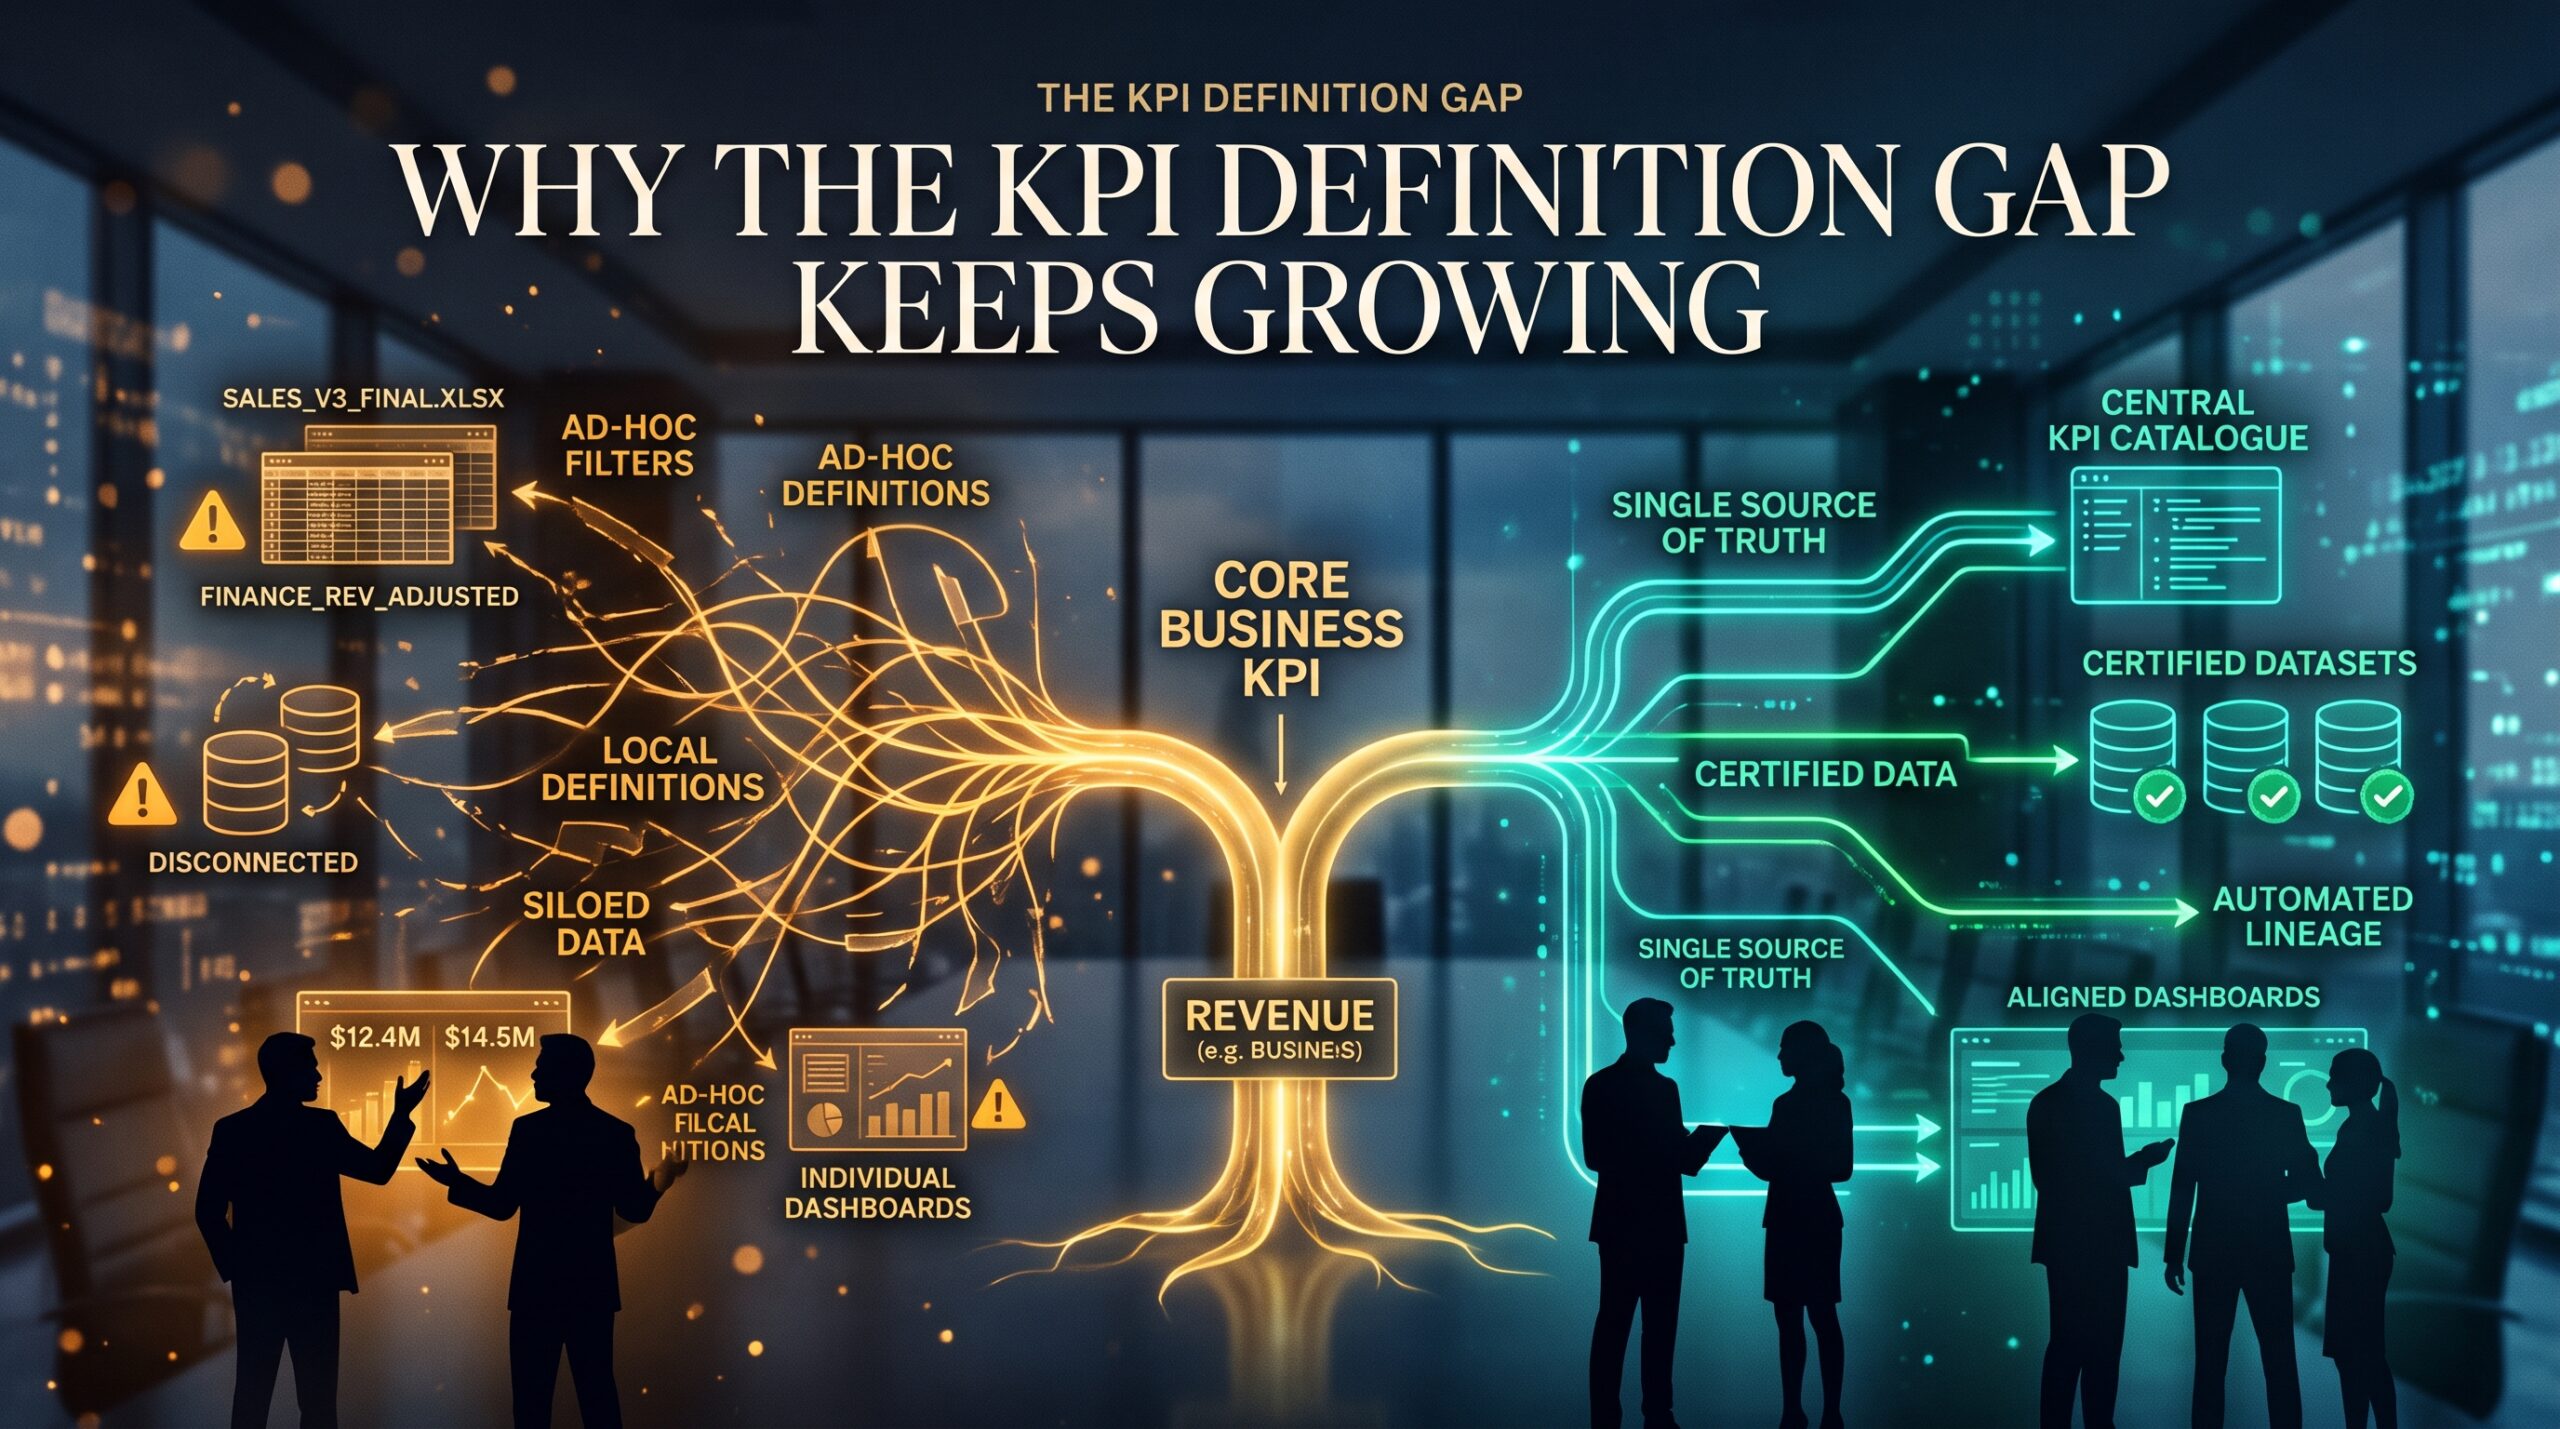
1. Each department owns its own system
Sales lives in a CRM, finance in an accounting or ERP system, and operations in a warehouse, scheduling or inventory system. Every tool has its own fields, rules and timing, so each team builds reports from a different starting point.
2. Definitions live in people, not documents
The rule for calculating a KPI sits in a spreadsheet formula, a DAX measure or someone’s memory. When that person moves on, the logic goes with them.
3. Reports multiply faster than governance
Self-service tools make it easy for anyone to create a report. That is a strength, but without shared rules each new report adds another interpretation of the same metric.
4. Targets are set in one place and measured in another
A sales target may be agreed on bookings, while finance tracks progress on invoiced revenue. The team appears to miss or beat the target depending on whose report you read.
5. Nobody is asked to arbitrate
Without a clear decision-maker for each KPI, disagreements are settled by whoever argues loudest, and the settlement is rarely written down.
The Real Cost of the KPI Definition Gap
- Slower decisions. Meetings spend time reconciling numbers instead of acting on them.
- Eroded trust. Once leaders see two versions of the truth, they start doubting every dashboard, a theme we explore in our article on confidence in data.
- Wasted analyst time. Analysts spend days explaining why two reports differ, and then rebuild them to match.
- Conflicting incentives. Teams are rewarded on their own definition of success, which can pull them in opposite directions.
- Customer impact. If sales promises a date that operations measures differently, customers feel the mismatch.
- Reporting risk. Inconsistent figures in board packs or external reports damage credibility. Items such as GST treatment, which the Australian Taxation Office explains in detail, are a common source of silent differences between teams.
Put simply, the KPI definition gap converts a reporting investment into a source of debate.
Warning Signs of the KPI Definition Gap
Check how many of these sound familiar. Several ticks suggest the KPI definition gap is already affecting your business.
- Sales, finance and operations bring different numbers to the same meeting.
- The first ten minutes of a review are spent agreeing which report to use.
- A KPI name appears on several dashboards with slightly different values.
- Nobody can quickly point to the written definition of a key metric.
- New staff are told “it depends who you ask”.
- Analysts keep private spreadsheets to reconcile the official reports.
- Targets are discussed in one measure and reported in another.
- You have more than one measure with a near-identical name in your Power BI models.
How to Close the KPI Definition Gap: A Practical Plan
Closing the KPI definition gap is mostly a conversation, followed by a small amount of careful modelling. Work through these steps in order.
- Start with the KPIs that cause the most arguments. Pick five to ten that appear in leadership meetings, such as revenue, margin, active customers, on-time delivery and conversion rate.
- Bring the three teams into one room. Put sales, finance and operations together with an analyst and a senior sponsor who can make the final call.
- Agree one business definition per KPI. Write it in plain English first, for example what counts, what is excluded and which date is used.
- Capture the technical specification. Record the source system, formula, filters, grain, time period, currency, tax treatment, refresh frequency and the named owner.
- Decide how to handle legitimate differences. If finance truly needs invoiced revenue and sales needs bookings, give them different names, such as “Bookings” and “Recognised revenue”, rather than one shared label.
- Publish a KPI dictionary. Keep it in one accessible place and link to it from every dashboard.
- Build the definition once in your data model. In Power BI, create the measure in a shared, governed semantic model and let every report reuse it. Add descriptions to each measure so users see the definition inside the report.
- Label trusted content. Use the endorsement features in the Power BI service to promote or certify the models people should rely on.
- Set a change process. Any change to a definition should be approved by the KPI owner, logged with a date and communicated to report users.
- Review regularly. Revisit the dictionary each quarter, and after any restructure or system change.
A shared KPI dictionary and one governed model resolve most of the KPI definition gap. The rest is habit.
Power BI and the KPI Definition Gap
Power BI makes the KPI definition gap visible, and it can also help you close it. The risk is that every report author writes their own calculation. The opportunity is that one well-built semantic model can serve hundreds of reports with the same logic. The official Power BI site and Microsoft Learn provide reference documentation on data modelling, measures and governance features.
For a reporting team, that means three disciplines. First, model the data cleanly so that sales, finance and operations tables relate correctly. Second, write measures once, with clear names and descriptions. Third, separate trusted, certified content from experimental reports, so users know which numbers to rely on. Our article on Power BI dashboard design explains why clarity matters as much as accuracy.
Skills That Help You Close the KPI Definition Gap
Agreeing a definition is a business decision. Implementing it reliably takes skill. Here is how our courses support each stage.
Building reliable reports. The Power BI Beginner Course teaches you to connect and transform data with Power Query and build your first interactive dashboard.
Writing measures that match the definition. The Power BI Intermediate Course covers DAX calculations, drill-through pages and governance, which is where KPI definitions become measures.
Enterprise-grade models. The Power BI Advanced Course goes deeper into complex DAX, time intelligence and model optimisation for organisations with many users and many reports.
Certification. The PL-300 Microsoft Power BI Data Analyst course prepares you for the certification exam, and the Introduction to Microsoft Power Platform (PL-900) helps newcomers understand where Power BI fits alongside the wider platform.
Scaling up with Fabric. The DP-600 Microsoft Fabric Analytics Engineer course suits professionals building shared data foundations at scale.
Technical skill also needs interpretation. Our articles on data interpretation and the business value of data explain why explaining the number matters as much as calculating it.
KPI Definition Gap Across Australian Cities
The KPI definition gap appears wherever several departments share a business. Here is how it tends to look in each city, and how you can train.
Sydney. Finance, technology and professional services firms often have many reporting teams, which multiplies definitions. Join face-to-face training at our Surry Hills centre or learn online through our Power BI course in Sydney.
Melbourne. Retail, healthcare and manufacturing organisations often reconcile sales, finance and supply data. See our Power BI course in Melbourne, available in West Melbourne or live online.
Brisbane. Growing logistics, property and resources businesses need consistent KPIs across sites. Explore our Power BI course in Brisbane.
Perth. Mining and energy operations compare production, cost and revenue across remote locations. Learn about our Power BI courses in Perth, delivered live online or in-house.
Adelaide. Health, defence and education employers need clear, shared performance measures. Read about our Power BI course in Adelaide, delivered live online or in-house.
Canberra. Government agencies and suppliers need consistent reporting across departments. See our Power BI course in Canberra, delivered live online or in-house.
We also deliver customised team programs onsite or virtually. Browse every option on our locations page.
KPI Definition Gap: Frequently Asked Questions
What is the KPI definition gap?
It is the difference between how teams such as sales, finance and operations define and calculate the same KPI, which leads to different numbers for what appears to be the same metric.
Why do sales and finance report different revenue?
Sales often counts revenue when a deal is signed or booked, while finance counts it when it is invoiced or recognised under accounting rules. Both are valid, but they measure different events.
How do I get departments to agree on one KPI definition?
Bring the teams together with a decision-making sponsor, agree a plain-English definition, record the technical specification and publish it in a KPI dictionary. If the teams truly need different measures, give them different names.
How does Power BI help standardise KPIs?
You can create a measure once in a shared semantic model, add a description, and reuse it across many reports. Promoted or certified content helps users identify trusted sources.
Which Power BI course should I take to manage KPI definitions?
The Intermediate course covers DAX and governance, and the Advanced course covers complex measures and model optimisation. The PL-300 course is the right choice if you also want certification.
Close the Gap and Start Discussing Decisions
The KPI definition gap is not a sign that your teams are difficult. It is a sign that nobody has written down what the numbers mean. Agree the definitions, give each KPI an owner, build it once in a governed model and publish the dictionary. Then your leadership meetings can focus on what to do next.
If you want your team to build consistent, trusted reports, review our Power BI courses, read the FAQs or contact our team to choose the right course. Start closing the KPI definition gap today.