




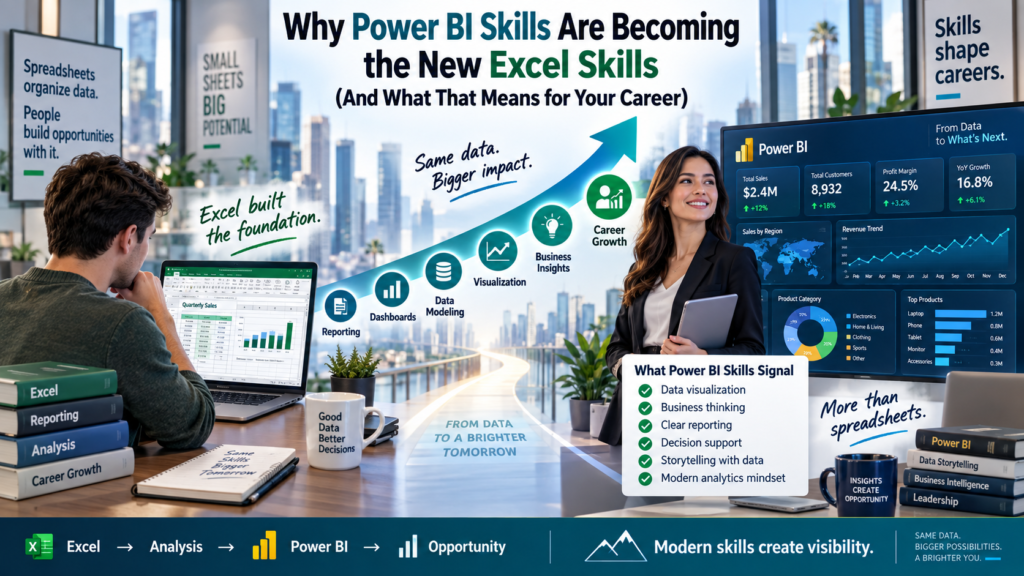
Ten years ago, listing “Excel” on a résumé was enough to signal that you could work with data. That is no longer true. Job ads across finance, marketing, operations, and HR increasingly name a second tool alongside it, and the phrase making the rounds in Australian hiring circles is simple: Power BI is the new Excel. It is not replacing Excel outright it is becoming the expected next step for anyone who wants to be seen as genuinely data-capable.
Thank you for reading this post, don't forget to subscribe!This shift is not hype. It reflects a real change in what businesses need from their staff: not just someone who can enter numbers into a spreadsheet, but someone who can turn scattered data into a live dashboard leadership can check on any day of the week. Understanding why Power BI is the new Excel and what to do about it is quickly becoming one of the most practical career moves a professional can make in 2026.
What Does “Power BI Is the New Excel” Actually Mean?
The phrase power bi is the new excel does not mean Excel is obsolete. Excel remains the tool most people use daily for quick calculations, ad-hoc analysis, and small datasets. What has changed is the ceiling. Excel is increasingly treated as the entry point, while Power BI is treated as the tool that proves you can operate at a higher level building connected, automated, shareable dashboards instead of static spreadsheets that go stale the moment they’re emailed out.
Industry skills research consistently shows business intelligence and data visualisation tools rising fastest in employer demand see LinkedIn’s Jobs on the Rise research for the broader hiring-demand trend behind this shift.
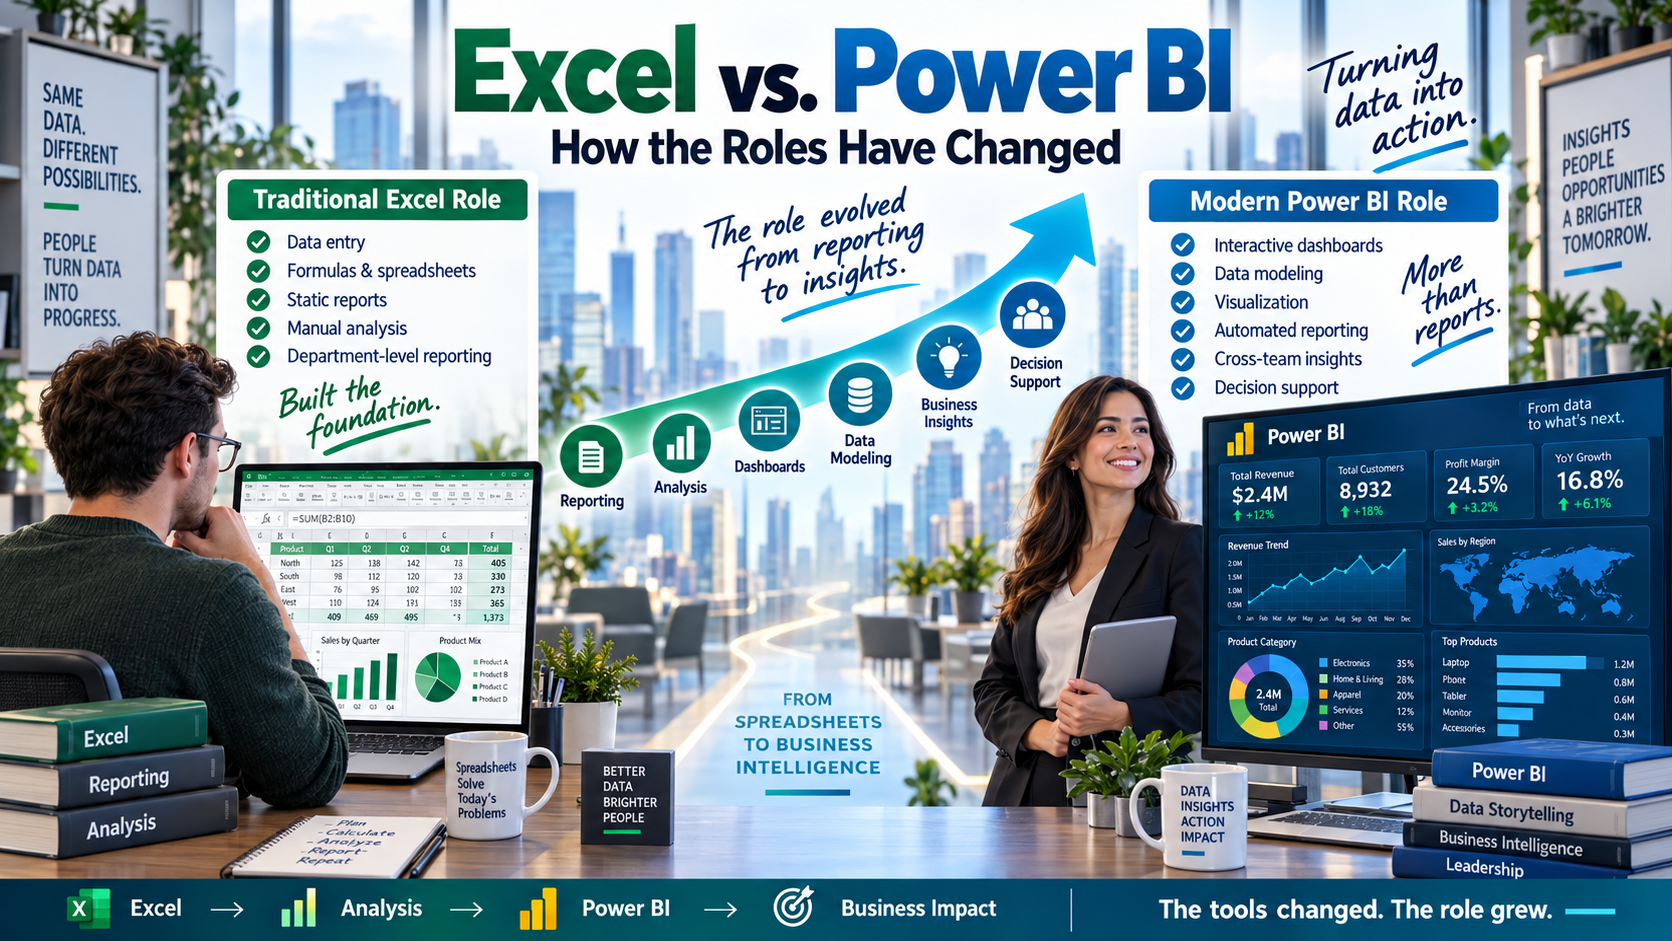
Excel vs. Power BI: How the Roles Have Changed
The table below shows how the two tools now sit side by side in a modern data-literate role, rather than one simply replacing the other.
| Capability | Excel | Power BI |
| Best For | Quick calculations, ad-hoc analysis | Live dashboards, ongoing reporting |
| Data Size | Struggles beyond ~1 million rows | Handles millions of rows smoothly |
| Data Sources | Mostly manual imports | Connects to multiple live sources automatically |
| Sharing | Emailed file, quickly outdated | Shared, always up to date via Power BI Service |
| Core Skill Tested | Formulas, PivotTables | DAX, data modelling, Power Query |
| Career Signal | Baseline competency | Advanced, analyst-track credibility |
Why the Shift Is Happening Now
Three forces are pushing power bi is the new excel from a talking point into a hiring reality. First, data volumes have grown past what spreadsheets can comfortably handle a single sales or operations dataset can now exceed a million rows, well outside Excel’s comfort zone. Second, businesses want reporting that updates itself, not a spreadsheet someone has to manually refresh every Monday morning. Third, Microsoft has deliberately positioned Power BI as the natural next step from Excel, with shared formula logic, Power Query in both tools, and increasingly, AI features like Copilot appearing across the whole Microsoft data stack.
How This Shows Up in Job Ads Across Australia
Recruiters in Sydney, Melbourne, Brisbane, Perth, Adelaide, and Canberra are already writing Power BI into roles that, a few years ago, only asked for Excel.
In Sydney, finance and banking roles increasingly list Power BI alongside Excel for reporting and forecasting work. In Melbourne, marketing and retail analytics roles expect dashboard-building skills for campaign and sales tracking. In Brisbane, operations and logistics employers want live inventory and performance dashboards rather than static spreadsheets. In Perth, resources and mining-adjacent businesses increasingly test Power BI for safety and production reporting. In Adelaide, growing SME and public-sector-adjacent teams reward staff who can self-serve dashboards without waiting on IT. In Canberra, government and policy roles list business intelligence and data visualisation skills as selection criteria more often each year.
The pattern holds nationally: power bi is the new excel is not a big-city trend. It is showing up in job ads across every major Australian employment market.
What This Means for Your Career
If you only know Excel, you are not behind but you are standing where most of the workforce already stands, which makes it hard to stand out. Adding Power BI on top of solid Excel skills moves you from “can handle data” to “can build the reporting the whole team relies on.” That distinction is increasingly what separates who gets considered for analyst, coordinator, and team-lead roles from who gets passed over.
- Data analysts and BI developers now list Power BI as a baseline requirement, not a bonus.
- Finance and operations roles increasingly expect self-service dashboards instead of manual monthly reports.
- Marketing and sales roles use Power BI to track live campaign and pipeline performance.
- Team leads and managers are expected to read and build simple Power BI reports, not just request them from someone else.
How to Make the Move From Excel to Power BI
The good news: Power BI is not a separate universe from Excel. It reuses many of the same concepts tables, relationships, and formulas which is exactly why professionals with a solid Excel foundation tend to pick it up faster than expected.
- Start with your existing Excel data import a spreadsheet you already know well into Power BI.
- Learn Power Query first the data-cleaning logic is nearly identical to what you already do in Excel.
- Move on to basic DAX formulas, which mirror Excel formula logic in a new context.
- Build one real dashboard end-to-end rather than following disconnected tutorials.
- Get structured, instructor-led training so you learn the workflow employers actually use, not just isolated features.
A structured Power BI course is the fastest way to make this transition, because it’s built specifically for professionals moving from spreadsheet-level Excel skills into dashboard-level Power BI skills.
If your role also involves broader reporting and statistical work, pairing Power BI with a data analytics course builds the wider analyst skill set employers are now hiring for.
For a closer look at exactly which skills employers are testing for, see our earlier guide on Power BI skills employers want, and how that compares in our post on Power BI certification vs real dashboard experience. If you’re just getting started, our guide on why most Power BI learners never become data analysts covers the mistakes to avoid early on.
All Power BI and Excel training is delivered as part of Logitrain’s Australia-wide IT and business skills training programs, with instructor-led options for professionals nationwide.
Frequently Asked Questions
Is Power BI really replacing Excel?
No. Power BI is not replacing Excel it’s becoming the expected next skill on top of it, especially for reporting, dashboards, and larger datasets.
Do I need to know Excel before learning Power BI?
It helps. Strong Excel skills, especially formulas and PivotTables, make Power BI concepts like DAX and Power Query far easier to pick up.
How long does it take to learn Power BI if I already know Excel?
Many Excel-confident professionals can build their first real dashboards within a few weeks of structured, hands-on training.
Final Word
Power BI is the new Excel in the sense that matters most for your career: it’s quickly becoming the tool employers expect from anyone who wants to be seen as genuinely data-capable, not just data-literate. The professionals moving fastest right now are not choosing between Excel and Power BI they’re building on the Excel skills they already have and using them as the foundation for Power BI.