

Power Query vs DAX is one of the first genuinely confusing decisions new Power BI learners face, because both sound essential and both show up in almost every tutorial. The short answer: learn Power Query first. It’s the foundation everything else in Power BI sits on top of, and trying to learn DAX before it usually means fighting messy, poorly structured data the whole way through. This guide breaks down the Power Query vs DAX decision properly, so you can build skills in the right order instead of guessing.
Thank you for reading this post, don't forget to subscribe!Power Query vs DAX: What’s the Difference?
What Power Query Does
Power Query is Power BI’s data preparation engine. It connects to your data sources, cleans messy columns, removes duplicates, merges tables, and reshapes data into the structure your report actually needs all without writing formulas in the traditional sense. Microsoft’s own Power Query documentation describes it as the data connectivity and preparation engine shared across Power BI, Excel and Microsoft Fabric. Every step you take in Power Query is recorded visually in the Applied Steps pane, which makes it approachable even for people with no coding background.
What DAX Does
DAX (Data Analysis Expressions) is the formula language used inside Power BI’s data model to create calculated columns, measures, and custom aggregations. Microsoft’s DAX overview explains that DAX formulas closely resemble Excel formulas but are built specifically to work with relational data and context. Where Power Query shapes the raw data, DAX calculates and analyses it — things like year-over-year growth, running totals, or a ratio that changes depending on which filters a user applies to a report. In the Power Query vs DAX relationship, DAX only works well once the data underneath it is already clean and properly structured.
Why Power Query Comes First in Every Power BI Workflow
The Power Query vs DAX order isn’t arbitrary — it follows the natural flow of a Power BI project. You can’t write a meaningful DAX measure on top of a table with duplicate rows, inconsistent date formats, or columns that haven’t been split correctly. Most experienced Power BI developers spend 60–70% of project time in Power Query and data modelling, only reaching for DAX once the underlying tables are trustworthy. Skipping ahead to DAX before mastering Power Query is the single most common reason beginner reports produce incorrect numbers.
When You Actually Need DAX
DAX becomes essential the moment your report needs a calculation that isn’t already a column in your source data — things like a percentage of total, a comparison to the same period last year, or a measure that responds dynamically to slicers and filters. If your reporting is genuinely simple (a straightforward table or chart from clean source data), you may get surprisingly far using nothing but Power Query and Power BI’s built-in aggregations. Most real business reporting, though, eventually needs at least basic DAX.
Power Query vs DAX: Skill Comparison
| Aspect | Power Query | DAX |
| Purpose | Cleans and shapes data | Calculates and analyses data |
| When used | Before loading data into the model | Inside the data model, on clean data |
| Learning curve | Beginner-friendly, mostly visual | Steeper, formula and logic based |
| Core skill | Data transformation logic | Filter context and aggregation logic |
| Typical first use | Removing duplicates, merging tables | Year-to-date sales, percentage of total |
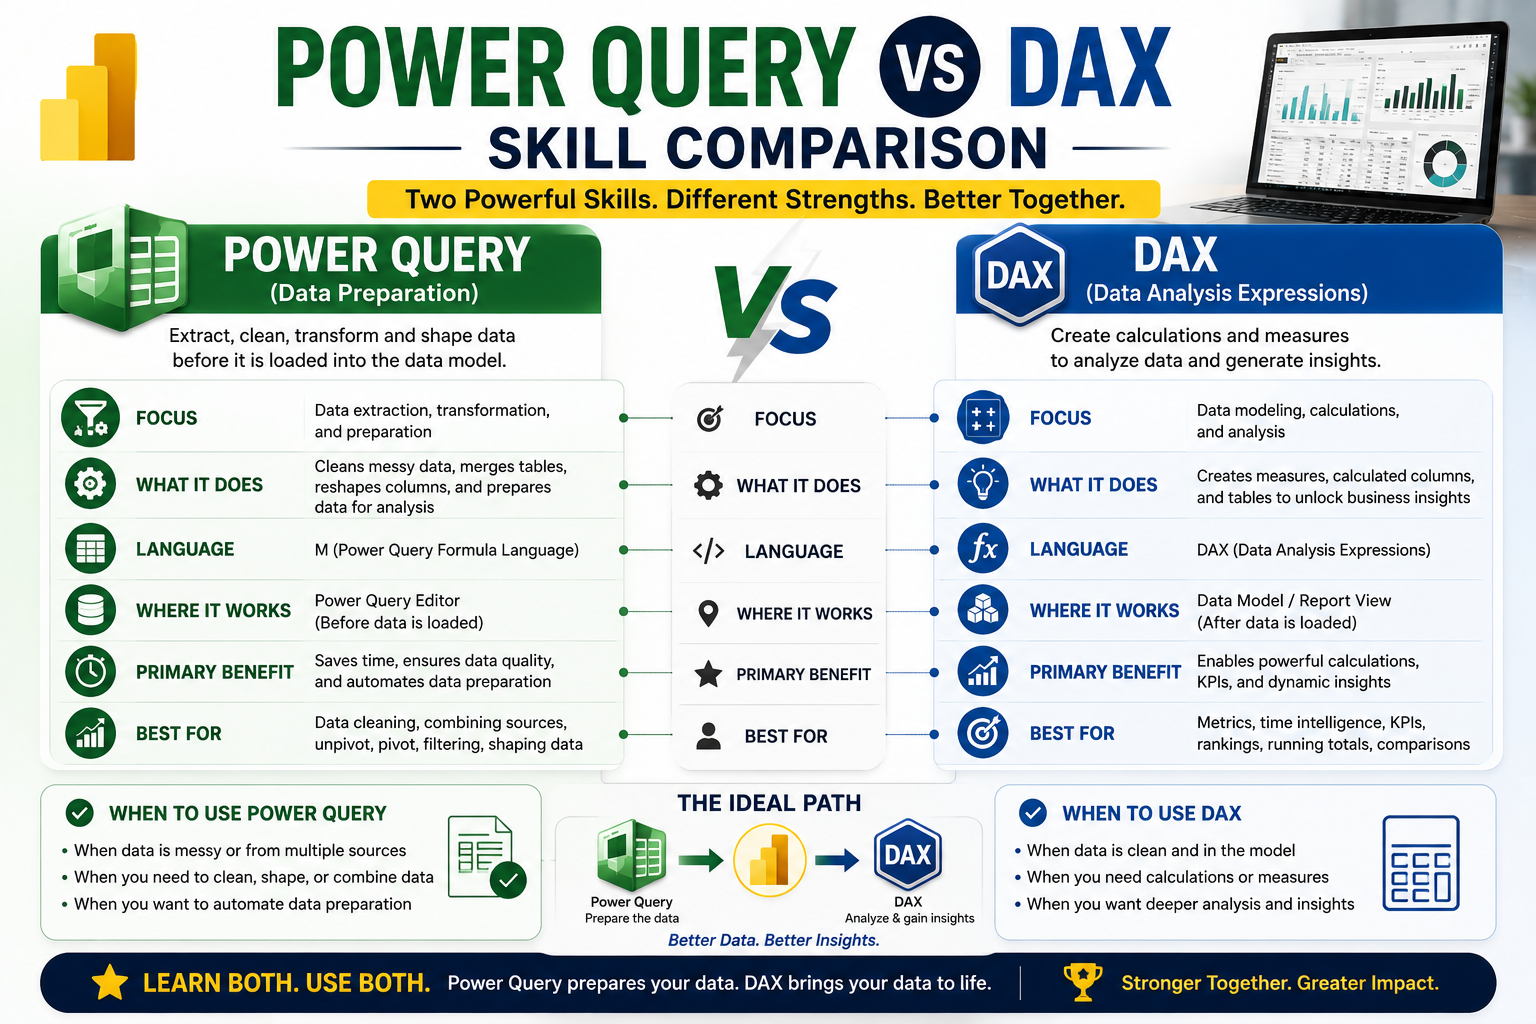
Common Beginner Mistakes: Jumping to DAX Too Early
- Writing complex DAX measures on top of data that still has duplicate or missing rows.
- Trying to fix data quality issues with DAX instead of fixing them at the source in Power Query.
- Skipping a proper date table, which makes time-intelligence DAX functions unreliable.
- Rebuilding the same transformation logic repeatedly in DAX instead of solving it once in Power Query.
Power Query vs DAX: Which Is Harder to Learn?
Most learners find Power Query easier to pick up initially because it’s largely visual you click through transformation steps rather than memorising syntax. DAX has a steeper learning curve because it introduces concepts like row context and filter context, which behave differently from typical spreadsheet formulas. This is exactly why the Power Query vs DAX learning order matters: building confidence with Power Query first gives you a mental model of the data that makes DAX’s logic click faster later on.
A Realistic Learning Path for Power BI Professionals
- Learn Power Query fundamentals: connecting to data, removing errors, merging and appending queries.
- Learn basic data modelling: relationships, star schema, and a proper date table.
- Learn foundational DAX: SUM, CALCULATE, simple measures and calculated columns.
- Learn intermediate DAX: time intelligence, filter context, and iterator functions like SUMX.
- Combine both skills on real projects, using Power Query to keep the model clean as requirements change.
Real-World Example: Building a Sales Dashboard
Picture a Power BI learner building their first sales dashboard. They start in Power Query, connecting to a messy CSV export, splitting a combined date-and-time column, and merging it with a product lookup table. Only once that data is clean do they move into DAX to build a year-over-year growth measure and a running total. This same Power Query vs DAX sequence plays out identically whether the learner is training in Melbourne, Sydney, Brisbane, Perth, Adelaide or Canberra the tools and the order of operations don’t change with location.
How to Learn Power Query and DAX the Right Way
Our Power BI Beginner Course starts exactly where this guide recommends connecting to data and mastering Power Query before any DAX is introduced. The Power BI Intermediate Course then builds core DAX formulas and dynamic report pages, and the Power BI Advanced Course covers complex DAX with iterator and time-intelligence functions alongside enterprise-grade data modelling. If certification is your goal, our PL-300 Microsoft Power BI Data Analyst course covers both skill sets in the sequence Microsoft’s own exam expects.
For more context on how these skills fit into the broader Power BI landscape, see our guides on Power BI Skills Australia 2026: DAX, SQL and Fabric and Power BI Beginner vs Intermediate vs Advanced Course. Courses are available in Melbourne, Sydney, Brisbane and Perth, or get in touch to find the right starting point for your current skill level.
FAQs: Power Query vs DAX
Can I skip Power Query and just learn DAX?
Technically yes, but you’ll likely build reports on messy data and produce unreliable results most professionals still circle back to learn Power Query properly.
Is DAX similar to Excel formulas?
DAX looks similar to Excel syntax on the surface, but its filter context and row context behave very differently, so Excel experience only partially transfers.
How long does it take to learn Power Query and DAX?
Most learners get comfortable with core Power Query in 1–2 weeks of regular practice, with foundational DAX taking a further 3–4 weeks to feel confident.
Do I need both skills for the PL-300 exam?
Yes. The Microsoft PL-300 exam tests both data preparation (Power Query) and data modelling and calculations (DAX) in depth.
Final Thoughts
The Power Query vs DAX question isn’t really an either/or you’ll need both to build professional Power BI reports. But the order matters: master Power Query first so your data is clean and well-structured, then layer DAX on top for calculations and dynamic analysis. If you’d like a structured course that teaches both in the right sequence, explore our full range of Power BI courses or contact our team to find the right starting point.