





Learning to build your first Power BI dashboard is one of the most valuable skills you can add to your CV in Australia right now, whether you’re in finance, operations, marketing, or government reporting. This step-by-step tutorial walks you through the entire process from connecting your data in Power BI Desktop to publishing a polished, interactive dashboard with no prior experience required.
Thank you for reading this post, don't forget to subscribe!What You Need Before You Start
Before you build your first Power BI dashboard, download Power BI Desktop, which is free from Microsoft, and have a sample dataset ready an Excel file with sales, HR, or operational data works well for practice. No coding background is required for this tutorial, though basic familiarity with Excel will make the data shaping steps faster.
Step 1: Connect Your Data
Open Power BI Desktop and select Get Data, then choose your source Excel, SQL Server, SharePoint, or a CSV file are the most common starting points for beginners. Power BI will preview your table before loading it, so you can confirm you’re pulling in the correct columns.
Step 2: Clean and Shape Data with Power Query
Once your data loads, open Power Query Editor to remove blank rows, rename columns, fix data types, and merge tables if needed. This step is where most of the real work in any Power BI dashboard happens clean data at this stage means fewer errors in your visuals later.
Step 3: Build Your Data Model
In the Model view, connect your tables by dragging fields to create relationships for example, linking a Sales table to a Date table. A well-structured data model is essential before writing any DAX formulas, since incorrect relationships will produce misleading numbers on your dashboard.
Step 4: Create Your First Visuals
- Drag a bar chart or column chart onto the canvas to show totals by category.
- Add a line chart to show trends over time using your Date table.
- Insert a card visual to highlight a single key metric, such as total revenue.
- Use a table or matrix visual for detailed, row-level data.
Each visual updates automatically as you refine your underlying data model, which is what makes Power BI dashboards far more efficient to maintain than static Excel reports.
Step 5: Add Filters and Slicers
Add slicers for fields like region, date, or department so users can interact with the dashboard without needing you to rebuild the report each time. This is one of the most requested skills by employers, since interactive filtering turns a static report into a genuine self-service dashboard.
Step 6: Design, Format, and Publish Your Dashboard
Apply a consistent colour theme, align your visuals to a grid, and add a title and clear labels before publishing. Once you’re happy with the layout, use the Publish button to push your report to the Power BI Service, where it can be shared securely with your team or stakeholders.
Power BI Dashboard Skills Employers Want Across Australia
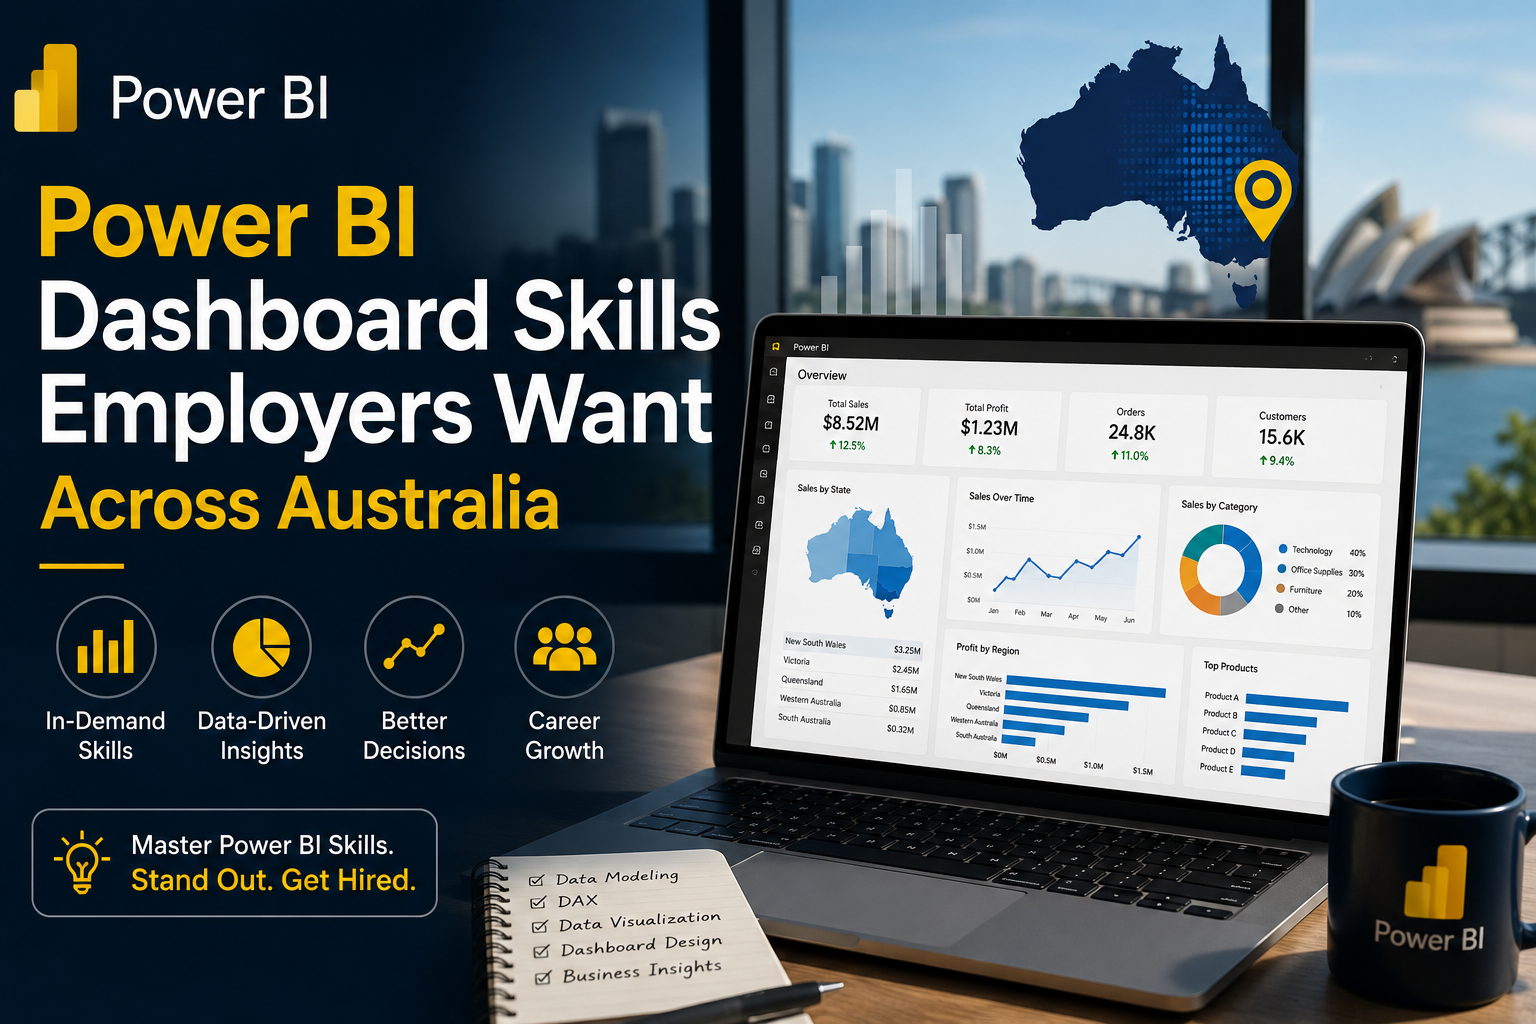
Once you can confidently build your first Power BI dashboard, the next step is knowing where that skill is most valued. Demand varies across Australia depending on the dominant local industries.
| City | Where Power BI Dashboard Skills Are in Demand |
| Sydney | Banking and financial services teams building executive KPI dashboards. |
| Melbourne | Retail and healthcare organisations tracking operational performance dashboards. |
| Brisbane | Government and infrastructure teams reporting on project and budget dashboards. |
| Perth | Mining and energy companies monitoring production and safety dashboards. |
| Adelaide | Defence and manufacturing sectors using dashboards for supply chain tracking. |
| Canberra | Federal government agencies relying on dashboards for compliance and budget reporting. |
Regardless of city, employers consistently favour candidates who can demonstrate an end-to-end workflow from raw data through to a published, interactive dashboard rather than isolated skills like chart formatting alone.
Common Mistakes Beginners Make When Building Dashboards
- Skipping the data cleaning step in Power Query and fixing errors visual-by-visual instead
- Overcrowding a single dashboard page with too many visuals
- Using inconsistent colours and fonts across visuals
- Building relationships incorrectly, leading to duplicated or inflated totals
- Publishing without testing filters and slicers from an end-user’s perspective
Where to Go After Your First Dashboard
Once you’re comfortable with the basics, the natural next step is learning DAX formulas and exploring certifications like PL-300, which validate your skills for Australian employers. According to job listings on Seek, Power BI proficiency is increasingly listed as a requirement rather than a preference across analyst, finance, and operations roles nationwide.
For official feature updates and documentation, Microsoft’s Power BI documentation is the most reliable reference as you continue building more advanced dashboards.
Frequently Asked Questions
Do I need coding skills to build my first Power BI dashboard?
No — this tutorial requires no coding background. Basic Excel familiarity is enough to get started, though learning DAX later will unlock more advanced calculations.
How long does it take to build a Power BI dashboard?
A simple first dashboard can be built in a few hours once your data is clean. More complex dashboards with multiple data sources and advanced DAX measures can take several days depending on complexity.
Is Power BI Desktop free to use?
Yes, Power BI Desktop is free to download and use for building reports. A Power BI Pro or Premium licence is only required for sharing and collaboration features within an organisation.
What is the difference between Power BI Desktop and Power BI Service?
Power BI Desktop is where you build and design your dashboard, while Power BI Service is the cloud platform used to publish, share, and collaborate on that dashboard with others.
Which Australian cities have the highest demand for Power BI dashboard skills?
Sydney and Canberra show particularly strong demand —Sydney due to its financial services sector, and Canberra due to federal government reporting requirements —though Melbourne, Brisbane, Perth, and Adelaide all show steady demand too.
Ready to Go Beyond Your First Dashboard?
If you want structured, guided training instead of piecing it together yourself, explore hands-on Power BI courses through Power BI Course Australia.